Fig. 1.
Download original image
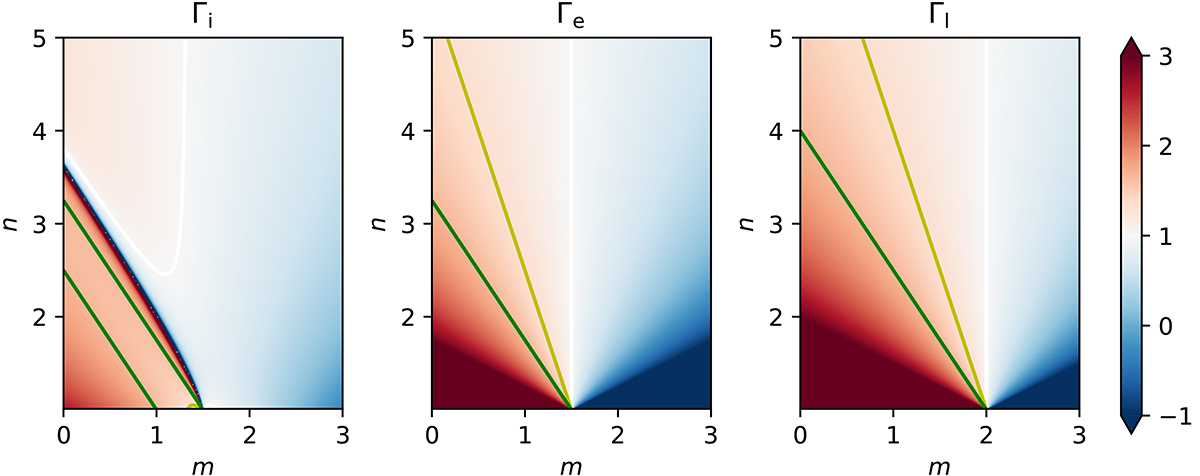
Apparent polytropic indices Γi, Γe, and Γl as functions of m and n. The critical values of 1, 4/3, and 5/3 are marked with white, yellow, and green contours, respectively. In regimes shown in red, the gas temperature increases with increasing density. In regimes shown in blue, the opposite happens. The values of Γ are shown irrespectively of the existence of a collapse solution, while the physical domain is shown in Fig. 3.
Current usage metrics show cumulative count of Article Views (full-text article views including HTML views, PDF and ePub downloads, according to the available data) and Abstracts Views on Vision4Press platform.
Data correspond to usage on the plateform after 2015. The current usage metrics is available 48-96 hours after online publication and is updated daily on week days.
Initial download of the metrics may take a while.