Open Access
Fig. 3.
Download original image
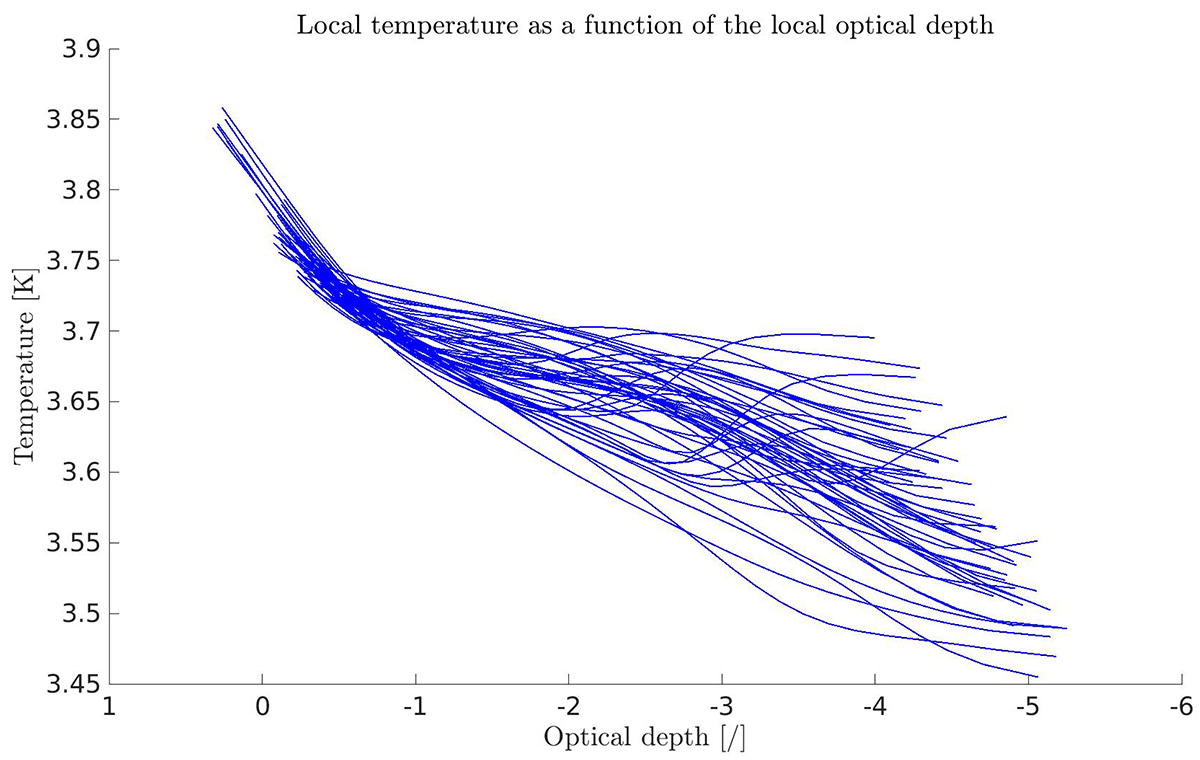
Evolution of the local temperature as a function of the local optical depth in CO5BOLD 3D simulation box. Each curve represents the evolution along one radial column. The data shown here were extracted from a low resolution simulation of the Sun performed with CO5BOLD (Grid nodes: 189 × 189 × 150).
Current usage metrics show cumulative count of Article Views (full-text article views including HTML views, PDF and ePub downloads, according to the available data) and Abstracts Views on Vision4Press platform.
Data correspond to usage on the plateform after 2015. The current usage metrics is available 48-96 hours after online publication and is updated daily on week days.
Initial download of the metrics may take a while.