Open Access
Fig. 1.
Download original image
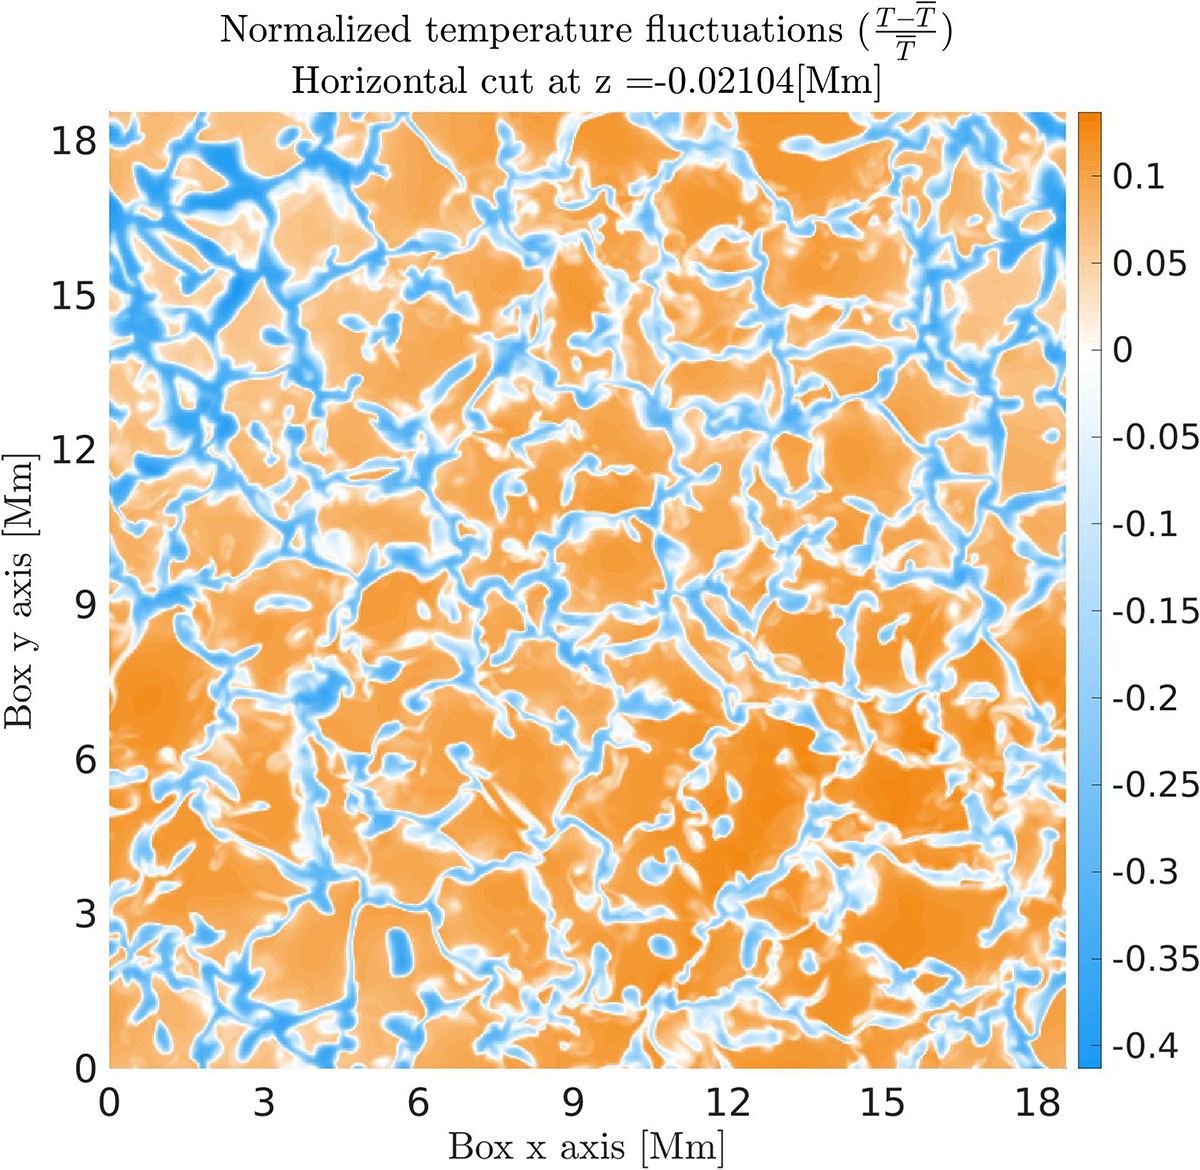
Horizontal cut of the CO5BOLD 3D simulation box below the photosphere of the normalized temperature. Blue shades correspond to downflows while orange shades identify upflows. The snapshot shown here corresponds to a high-resolution simulation of the Sun performed with CO5BOLD (Grid nodes: 534 × 534 × 424).
Current usage metrics show cumulative count of Article Views (full-text article views including HTML views, PDF and ePub downloads, according to the available data) and Abstracts Views on Vision4Press platform.
Data correspond to usage on the plateform after 2015. The current usage metrics is available 48-96 hours after online publication and is updated daily on week days.
Initial download of the metrics may take a while.