Open Access
Fig. 10
Download original image
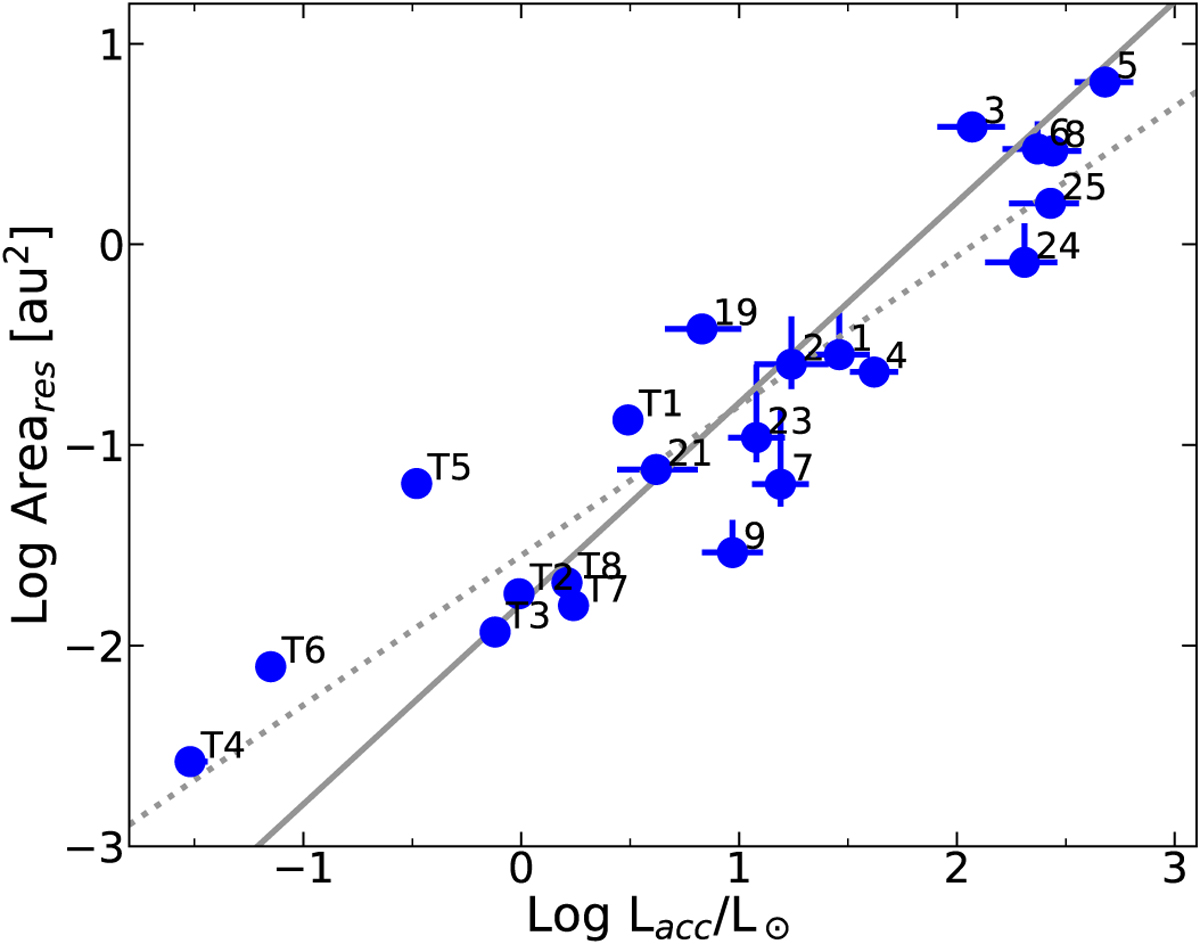
Area of the region emitting the marginally resolved Brγ component as a function of Lacc for both the Herbig AeBe and CTTs samples. The number labels are as in Fig. 9. The dotted and solid lines show the best-fitting line of slope 0.75 ± 0.04 (reduced χ2 of 0.15) and slope 1 (reduced χ2 of 0.24), respectively.
Current usage metrics show cumulative count of Article Views (full-text article views including HTML views, PDF and ePub downloads, according to the available data) and Abstracts Views on Vision4Press platform.
Data correspond to usage on the plateform after 2015. The current usage metrics is available 48-96 hours after online publication and is updated daily on week days.
Initial download of the metrics may take a while.