Fig. 10
Download original image
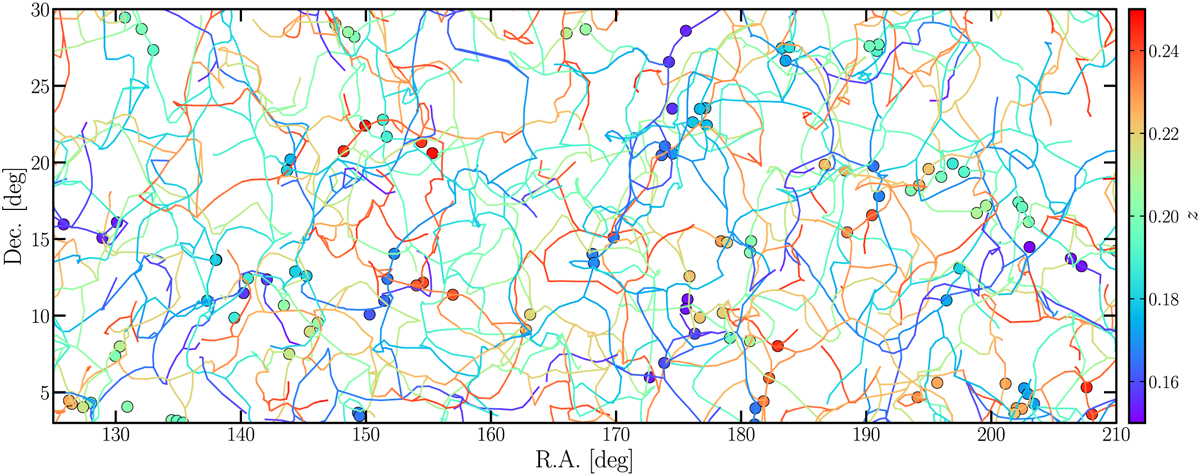
Comparison of the filaments detected with SDSS galaxies (Malavasi et al. 2020 curves) and the eRASS1 X-ray superclusters. The supercluster members are plotted with dots. Color codes denote redshifts for both the filaments and supercluster members. To reduce overlapping between optical filaments, only the region (125º < RA < 210º, 3° < Dec < 30°) and redshift range 0.15 < z < 0.25 are plotted in the figure.
Current usage metrics show cumulative count of Article Views (full-text article views including HTML views, PDF and ePub downloads, according to the available data) and Abstracts Views on Vision4Press platform.
Data correspond to usage on the plateform after 2015. The current usage metrics is available 48-96 hours after online publication and is updated daily on week days.
Initial download of the metrics may take a while.