Fig. 7.
Download original image
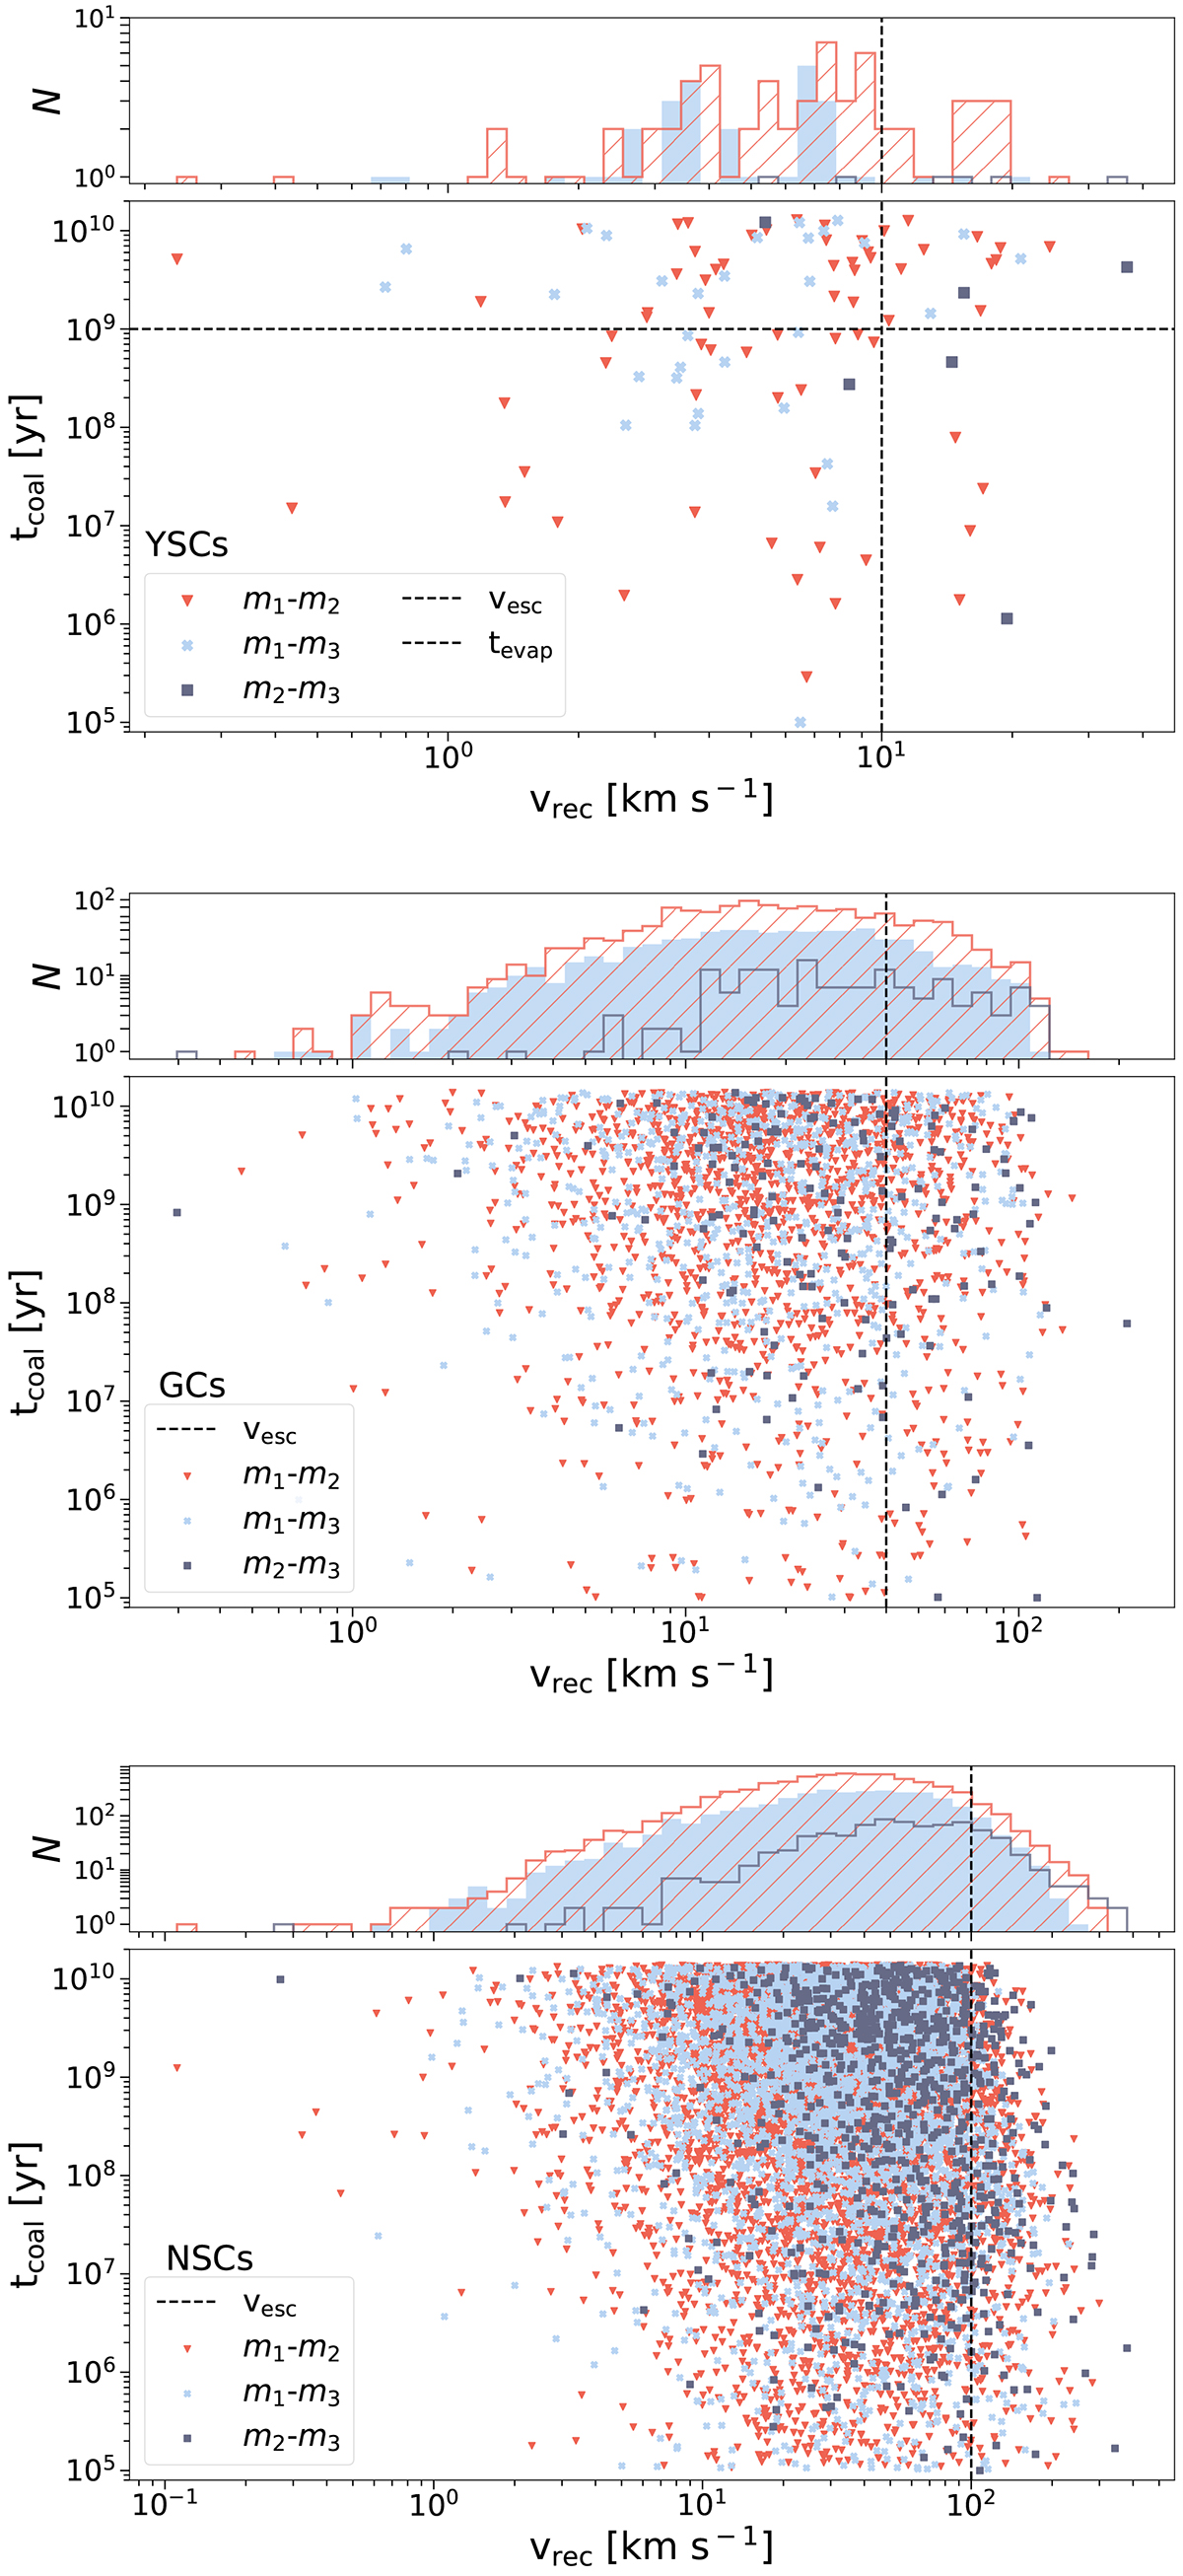
BBH mergers that take place after the three-body interactions in YSCs, GCs, and NSCs (from top to bottom). All the mergers that take place during the three-body interaction, i.e. < 106 yr, are assumed to merge inside the cluster. The x axis reports the recoil velocity caused by the energy exchange in the three-body encounter. The y axis shows the coalescence time of the binary from the beginning of the simulation. Different outcomes are shown with different markers and colours. In the YSCs case, the horizontal dashed line reports the typical evaporation time of a YSC. The vertical dashed line in all the plots shows the escape velocity of the cluster. Distributions of the recoil velocities are displayed as marginal histograms. The colour legend is the same as the scatter plot.
Current usage metrics show cumulative count of Article Views (full-text article views including HTML views, PDF and ePub downloads, according to the available data) and Abstracts Views on Vision4Press platform.
Data correspond to usage on the plateform after 2015. The current usage metrics is available 48-96 hours after online publication and is updated daily on week days.
Initial download of the metrics may take a while.