Fig. 2.
Download original image
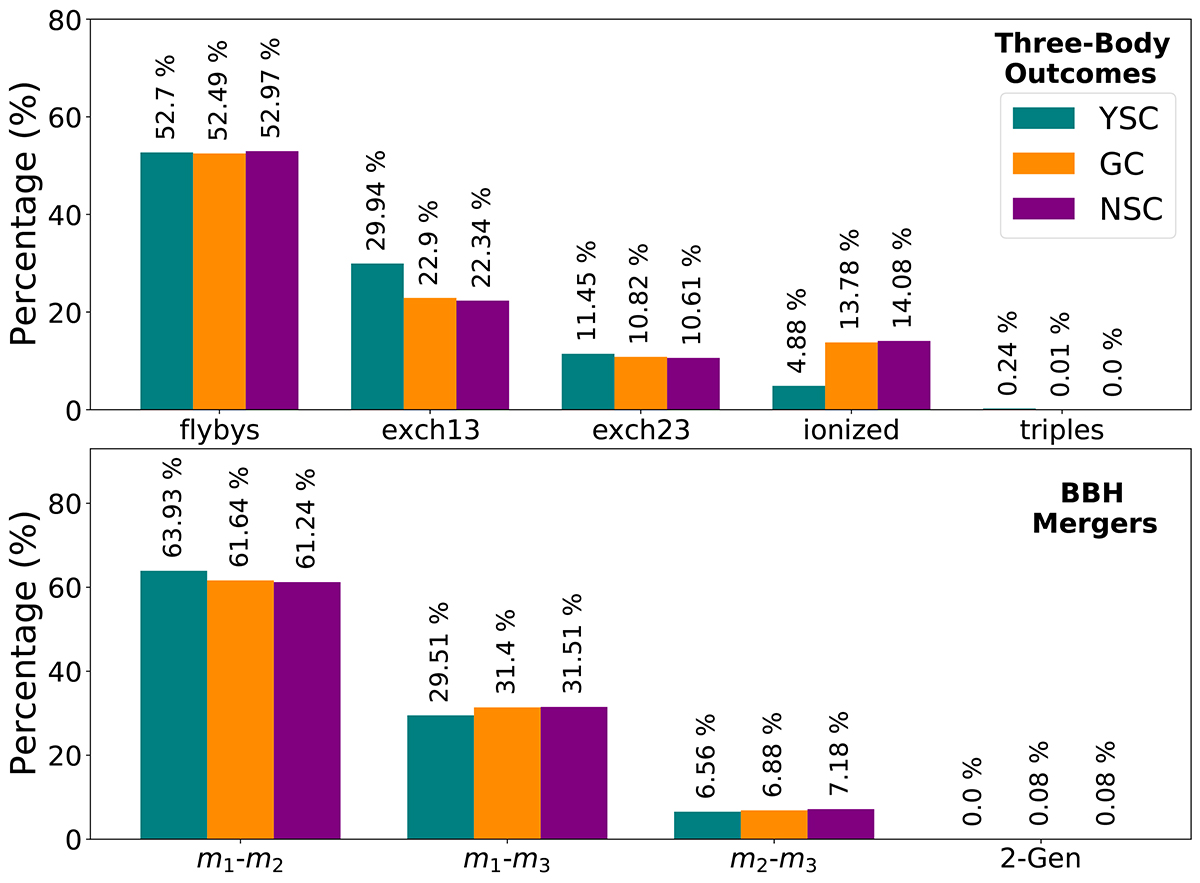
Upper panel: percentage of different interaction outcomes for each cluster type. From left to right: (i) flyby events, (ii) exchanges in which the intruder replaces the secondary BH, (iii) exchanges in which the intruder replaces the primary BH, (iv) ionisations, and (v) unstable triples. Lower panel: percentage of BBH mergers. From left to right: (i) BBH mergers occurring after a flyby, (ii) an exchange interaction with the secondary BH replaced by the intruder, (iii) an exchange with the primary BH replaced by the intruder, and (iv) second-generation BBH mergers. In both the upper and lower panels, the colours mark the cluster type in which the interaction takes place.
Current usage metrics show cumulative count of Article Views (full-text article views including HTML views, PDF and ePub downloads, according to the available data) and Abstracts Views on Vision4Press platform.
Data correspond to usage on the plateform after 2015. The current usage metrics is available 48-96 hours after online publication and is updated daily on week days.
Initial download of the metrics may take a while.