| Issue |
A&A
Volume 683, March 2024
|
|
|---|---|---|
| Article Number | L13 | |
| Number of page(s) | 13 | |
| Section | Letters to the Editor | |
| DOI | https://doi.org/10.1051/0004-6361/202348682 | |
| Published online | 20 March 2024 | |
Letter to the Editor
Rapid evolution of the recurrence time in the repeating partial tidal disruption event eRASSt J045650.3−203750
1
Max-Planck-Institut für extraterrestrische Physik, Gießenbachstraße 1, 85748 Garching, Germany
e-mail: This email address is being protected from spambots. You need JavaScript enabled to view it.
2
Max-Planck-Institut für Astrophysik, Karl-Schwarzschild-Str. 1, 85748 Garching, Germany
3
International Centre for Radio Astronomy Research, Curtin University, GPO Box U1987 Perth, WA 6845, Australia
4
Leibniz-Institut für Astrophysik Potsdam, An der Sternwarte 16, 14482 Potsdam, Germany
Received:
21
November
2023
Accepted:
28
February
2024
Abstract
In this letter, we present the results from subsequent X-ray and UV observations of the nuclear transient eRASSt J045650.3−203750 (hereafter, J0456−20). We detected five repeating X-ray and UV flares from J0456−20, marking it as one of the most promising repeating partial tidal disruption event (pTDE) candidates. More importantly, we also found rapid changes in the recurrence time, Trecur, of the X-ray flares by modelling the long-term X-ray light curve of J0456−20. We found that Trecur first decreased rapidly from about 300 days to around 230 days. It continued to decrease to around 190 days with an indication of a constant Trecur, as evidenced by the latest three cycles. Our hydrodynamic simulations suggest that, in the repeating pTDE scenario, such a rapid evolution of Trecur could be reproduced if the original star is a 1 M⊙ main sequence star near the terminal age, losing nearly 80–90% of its mass during the initial encounter with a supermassive black hole (SMBH) of a mass around 105 M⊙. The inferred mass loss of 0.8–0.9 M⊙ is higher than the estimated value of around 0.13 M⊙ drawn from observations, which could be explained if the radiation efficiency is low (i.e. ≪0.1). Our results indicate that repeating pTDEs could be effective tools for exploring the dynamics around SMBHs beyond our own Galaxy.
Key words: accretion / accretion disks / black hole physics / galaxies: nuclei / X-rays: individuals:: eRASSt J045650.3−203750
© The Authors 2024
 Open Access article, published by EDP Sciences, under the terms of the Creative Commons Attribution License (https://creativecommons.org/licenses/by/4.0), which permits unrestricted use, distribution, and reproduction in any medium, provided the original work is properly cited.
This article is published in open access under the Subscribe to Open model.
Open Access funding provided by Max Planck Society.
1. Introduction
Tidal disruption events (TDEs) are typically considered one-off events where a star is completely destroyed by a supermassive black hole (SMBH) at the first pericentre passage. However, theoretical calculations and numerical simulations have shown that a partial TDE (pTDE) can also occur (e.g. Guillochon & Ramirez-Ruiz 2013; Ryu et al. 2020). In a pTDE, the star loses only a fraction of its mass and survives its first encounter with the SMBH. If the star is initially in a bound orbit with low eccentricity, it is expected to generate repeating flares (e.g. Hayasaki et al. 2013; Ryu et al. 2020; Nixon & Coughlin 2022; Cufari et al. 2022, 2023; Melchor et al. 2024). Because the encounter cross-sections of pTDEs are generally larger than or comparable to those of full TDEs, the rate of pTDEs is expected to be larger or comparable to full TDEs (Krolik et al. 2020; Bortolas et al. 2023). Repeating pTDEs are particularly interesting as they may be effective probes to explore stellar dynamics around SMBHs beyond our own Galaxy and may also serve as ideal laboratories for studying the accretion processes in SMBHs.
Only a few repeating pTDE candidates have been reported so far (e.g. ASASSN-14ko, Payne et al. 2021; HLX-11, Webb et al. 2023; eRASSt J045650.3−203750, hereafter J0456−20, Liu et al. 2023; RX J133157.6−324319.7, Malyali et al. 2023; AT2018fyk, Wevers et al. 2023). Among these, J0456−20 is one of the best-studied repeating nuclear transients discovered in a quiescent galaxy (z = 0.077). Liu et al. (2023) reported the detection of three repeated X-ray and UV flares from J0456−20. In particular, the profiles of the X-ray flares are similar and can be characterised by four distinctive phases: an X-ray rising phase (PX,rise) leading into an X-ray plateau phase (PX,plat), which is terminated by a rapid X-ray drop phase (PX,drop) and followed by an X-ray faint state (PX,faint). These results provide strong evidence that J0456−20 is a repeating nuclear transient, making J0456−20 one of the most promising pTDE candidates.
Quasi-period eruptions (QPEs) are a class of recurring X-ray flares found in galactic nuclei, with periods of less than one day (Miniutti et al. 2019; Giustini et al. 2020; Arcodia et al. 2021). Their origin remains elusive, though recent studies indicate a potential link to pTDEs (e.g. GSN 069, Miniutti et al. 2023; RX J133157.6−324319.7, Malyali et al. 2023). The discovery of Swift J0230, which exhibits QPE-like behaviours with a period of around 22 days (Evans et al. 2023; Guolo et al. 2024), further strengthens the link between repeating pTDEs and QPEs. It is thus interesting to study the evolution of Trecur of the flares for repeating pTDEs. However, any substantial evolution in Trecur has only been reported in ASASSN-14ko and HLX-1. A period derivative of −0.0026 ± 0.0006, with a period of  days, has been reported for ASASSN-14ko (Payne et al. 2022). HLX-1 initially shows quasi-periodic X-ray outbursts spaced by about 1 yr between 2009 and 2012. Then, Trecur started to increase until 2018, with no X-ray outbursts detected afterwards (Godet et al. 2014; Webb et al. 2023). Long-term multi-wavelength observations on a larger sample of repeating pTDEs are required to fully understand the evolution of Trecur in these objects and potentially provide further evidence to confirm the connection between repeating pTDEs and QPEs.
In this letter, we report the discovery of the rapid evolution of Trecur in J0456−20. A detailed analysis of the latest X-ray and UV data has revealed five X-ray and UV flares in J0456−20 (marked as cycle 1–5 in Fig. 1). These results confirm that J0456−20 is indeed a repeating nuclear transient and also suggest an initially rapid decrease in Trecur by more than two months between cycles 1 and 2, slowing to around 40 days between cycles 2 and 3. Afterwards, Trecur reaches an almost constant value of around 190 days in the latest three cycles.
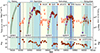 |
Fig. 1. Long-term X-ray and UV light curves for J0456−20. The coloured regions represent the four phases: the plateau phase (PX,plat, light cyan), the rapid drop phase (PX,drop, light blue), the faint phase (PX,faint, light yellow), and the rising phase (PX,rise, light green). Upper panel: red points with error bars are the unabsorbed rest-frame 0.2 − 2.0 keV X-ray light curve from eROSITA (hexagons), Swift/XRT (squares), NICER (circles), XMM-Newton (stars), and Chandra (diamonds). The error bars indicate 90% uncertainties. The points with downward arrows represent the 3σ flux and luminosity upper limits. The points with blue colour are the data used to model the profiles of the PX,rise phase. The green dashed lines show the best-fitting power-law model for the five X-ray rising phases. The grey shaded regions mark the 1σ uncertainty of the model. Bottom panel: UV light curve from Swift/UVOT UVM2 (red squares). The error bars mark the 1σ uncertainties. Squares with downward arrows indicate 3σ upper limits. The vertical lines mark the dates of the ATCA radio observations (black dashed-dotted: non-detections; blue dashed: detections). |
This paper is structured as follows. In Sect. 2, we present the multi-wavelength data reduction. X-ray spectral and light curve modelling are presented in Sect. 3. Finally, we discuss and summarise our results in Sects. 4 and 5. Throughout this paper, we adopt a flat ΛCDM cosmology with H0 = 67.7 km s−1 Mpc−1 and Ωm = 0.308 (Planck Collaboration VI 2020). Therefore z = 0.077 corresponds to a luminosity distance of Dld = 360 Mpc. All magnitudes will be reported in the AB system (not corrected for Galactic extinction). All the quoted uncertainties correspond to the 90% confidence level, unless specified otherwise.
2. Observations and data reduction
In this paper, we analysed all observations after MJD 59720. We refer to Liu et al. (2023) for more details on the data analysis prior to this date.
2.1. XMM-Newton
A pre-approved XMM-Newton target of opportunity (ToO) observation was performed on 2022 Aug. 23 (hereafter X5). In addition, two XMM-Newton Director’s Discretionary Time (DDT) observations were performed on 2023 Feb. 10 and Mar. 4 (hereafter X6 and X7, respectively). J0456−20 was detected in all new XMM-Newton observations.
The Observation Data Files (ODFs) for each observation were reduced using the XMM-Newton Science Analysis System software (SAS, version 19.1, Gabriel et al. 2004), with the latest calibration files. For each observation, the SAS tasks emchain and epchain tasks were used to generate the event lists for the European Photon Imaging Camera (EPIC) MOS (Turner et al. 2001) and pn (Strüder et al. 2001) detectors, respectively. High background flaring periods were identified and filtered from the event lists. For all the EPIC images, a circular region with a radius of 30, 20, 25″ was chosen as the source region for X5, X6, and X7, respectively. A source-free annulus region with an inner radius of 50″ and an outer radius of 100″ was chosen as the background region for all MOS observations. The background for the pn camera was extracted from a circular region with a radius of 60″ centred at the same CCD read-out column as the source position for all observations. X-ray events with pattern ≤12 for MOS and ≤4 for pn were selected to extract the X-ray spectra. We used the tasks rmfgen and arfgen to generate the response matrix and ancillary files, respectively. The X-ray spectra were rebinned to have at least one count per bin.
2.2. Swift observations
The XRT online data analysis tool2 (Evans et al. 2009) was used to check whether the source was detected for each observation. It was also used to generate the X-ray spectra for observations where J0456−20 was detected and to calculate the 3σ count rate upper limits for non-detections. The X-ray spectra were rebinned to have at least one count in each bin.
The Swift/UVOT data were reduced using the UVOT analysis pipeline provided in HEASOFT (version 6.31) with UVOT calibration version 20201215. Source counts were extracted from a circular region with a radius of 5″ centred at the source position. A 20″ radius circle from a source-free region close to the position of J0456−20 was chosen as the background region. The task uvotsource was used to extract the photometry.
2.3. NICER observations
The NICER data were analysed using HEASOFT with the NICER data analysis software (version 10) and calibration files (version 20221001). The nicerl2 task is used to generate cleaned X-ray events. Events with overshoot higher than 1.5 or undershoot larger than 300 were removed. The nicerl3-spec task was then used to generate the X-ray spectra for each NICER observation. The X-ray spectra were then rebinned to have at least one count per bin. We adopted the SCORPEON model to generate background models for each observation. The nicerarf and nicerrmf tasks were used to generate the response matrix and ancillary file for each observation, respectively. The same procedures were also adopted to re-analyse the NICER observations taken during the first two X-ray rising phases (i.e. observation carried out during MJD 59418-59448 and 59600-59641).
2.4. Chandra observations
We requested Chandra DDT observations of J0456−20, which were performed on 2023 Mar. 18, Apr. 11, and April 14 with the Advanced CCD Imaging Spectrometer (ACIS). We used the CIAO (Fruscione et al. 2006, version 4.15) software package to reduce the Chandra data with calibration files CALDB version 4.10.4. We reprocessed the Chandra data using the CIAO script chandra_repro. The CIAO task dmextract was used to extract the source and background spectra. We extracted the source spectra using a circular region with a radius of 2″. The background spectra were extracted using an annulus (concentric with the source) region with an inner and outer radius of 6″ and 20″, respectively. The response files were generated using the mkacisrmf and mkarf tasks. The position of the X-ray flare measured from Chandra is (RA, Dec) = (04 : 56 : 49.81, −20° 37′47.98″) with a 2σ uncertainty of 0.54″ (Appendix A), consistent with the centre of the host galaxy.
2.5. ATCA radio observations
We observed the coordinates of J0456−20 nine times with the Australia Telescope Compact Array (ATCA) between 2022 Aug. and 2023 Mar., in addition to the five observations between 2021 Mar. and 2022 Apr. reported in Liu et al. (2023). We observed the target during the X-ray outburst phase as this was previously when radio emission had been detected and therefore observed the target with the array in various configurations. In each observation, we used the dual 5.5 GHz and 9 GHz receiver, placing the 2×2 GHz of bandwidth split into 2048x1 MHz channels at a central frequency of 5.5 GHz and 9 GHz. Data were reduced in the Common Astronomy Software Application (CASA, version 5.6.3, CASA Team 2022) using standard procedures, including flux and bandpass calibration with PKS 1934-638 and phase calibration with PKS 0454-234. Additionally, we carried out one round of phase-only self-calibration of the target field at both 5.5 and 9 GHz, with a typical solution interval of two minutes, to produce a good quality image due to a bright AGN in the field. Images of the target field were created with the CASA task tclean and in cases where a source was visible at the location of J0456−20, the flux density was extracted with the CASA task imfit by fitting a Gaussian the size of the synthesised beam.
3. Data analysis and results
3.1. X-ray spectral modelling
The XSPEC software (version 12.13.0, Arnaud 1996) was used to fit all X-ray spectra using the Cash statistic (Cash 1979, Cstat in XSPEC). As mentioned in Liu et al. (2023), a power-law model (i.e. TBabs*zashift*cflux*powerlaw, hereafter Mpl) is preferred for observations taken at relatively high X-ray flux (i.e. the rest-frame unabsorbed 0.2–2.0 keV flux, fX,soft, ≳ 5 × 10⁻¹³ erg cm−2 s−1). We first fit all the new X-ray spectra with the Mpl model. The Galactic column density is fixed at 3.3 × 1020 cm−2.
For NICER data, we first fit the total X-ray spectra over the 0.25–10.0 keV range with the backgrounds model generated using SCORPEON. We then re-fit the data by adding the Mpl model. A 3σ upper limit for fX,soft was estimated for observations in which the fit did not improve significantly (i.e. ΔCstat < 11.8) after adding the Mpl model. A strong oxygen Kα line is presented in some of the NICER data. The niscorpv22_swcxok_norm parameter in the background model was thus left free to properly model the oxygen Kα line in those observations. We fit the background subtracted spectra with the Mpl model for the data from the other missions. The Swift/XRT X-ray spectra were fitted over the 0.3–5.0 keV energy range, while the 0.5–5.0 keV energy band was used for Chandra observations. For XMM-Newton data, we jointly fit the data from the three EPIC cameras over the 0.2–5.0 keV energy range for X5 and X7 (0.2–2.0 keV for X6). The best-fit values and the 90% uncertainties were calculated for the fX,soft and photon index parameters. In addition, the 68% uncertainties for the fX,soft were also estimated for observations taken during the PX,rise phase. The 3σ upper limits of fX,soft were calculated for non-detections using either the Mpl or a disk model (see below). The details of the fitting results are listed in Table C.2.
Liu et al. (2023) noticed that the UV-to-X-ray SEDs of J0456−20 can be described by a multi-colour disk model (TBabs*zashift*cflux*diskbb, hereafter Mmcd) when the X-ray flux is low. Thus, the Mmcd model was also used to fit the X-ray spectra at the early stage of the PX,rise phase, namely, observations taken between MJD 59600 and 59620 in cycle 3 and X6 in cycle 5. J0456−20 was detected only on MJD 59619 (NICER, ObsID: 4595020126, hereafter N26) and on MJD 59999 (X6). The best-fitting Tin and fX,soft are  eV and
  for X6 (N26), respectively. The Mpl model resulted in a higher fX,soft of
  with photon index of
  for X6 (N26). Both the Mmcd and the Mpl model fit the X6 and N26 spectra well, although the Mpl model gives a slightly better fit (Cstat/d.o.f. = 136/144, compared to 152/144) for X6.
In this work, we used the results from the Mmcd model for X6 and N26. The best-fitting Tin of N26 is comparable to that obtained from the eRASS2 and Swift observations (in the range of ∼50 − 100 eV, Liu et al. 2023) at similar fX,soft (i.e. ≈ 4 × 10⁻¹³ erg cm−2 s−1), while Tin is much higher during the X6 observation when J0456−20 was in a historically low X-ray flux. This suggests a potential change in Tin during the PX,rise phase. For this reason, different values of Tin (listed in Table C.2) were used to calculate the 3σ flux upper limits for NICER observations before N26 during cycle 3.
3.2. Modelling the X-ray rising phase
The PX,rise phases during cycles 2, 3, 4, and 5 were captured by our follow-up observations. We also assumed that J0456−20 is in the PX,rise phase of cycle1 during the eRASS2 observations. This is justified by the duration of the PX,drop phase being much shorter than the PX,rise phase and by the spectral property of eRASS2 (i.e. best described by the Mmcd model) being similar to that at the early stage of the PX,rise phase.
We jointly fit the five PX,rise phases with a power-law function frs,i(t) = A * (t − ti)β, where i = 1, 2, 3, 4, 5. We assumed that the normalisation, A, and power law index, β, were the same for all the five PX,rise phases. The lmfit package is adopted to fit the data with the least-squares method. To take into account upper limits and to estimate the uncertainties of the parameters in the model, we generated 105 realisations of fX,soft in the five PX,rise phases from Gaussian distributions for observations where J0456−20 has been detected as well as uniform distributions with a lower limit of zero (excluded) for non-detections. The best-fitting fX,soft and the 1σ uncertainties obtained from X-ray spectral modelling of each observation are used as the means and standard deviations of the Gaussian distributions, respectively. The 3σfX,soft upper limits for non-detections are used as the upper limits for the uniform distributions. We obtained 105 values for each parameter in the model by fitting the 105 datasets using the least squares method. We estimated the best-fitting values using the median values for each parameter and estimated the 1σ confidence intervals using the 16th and 84th percentiles of the fitting results. Similarly, the recurrence time Trecur for cycle i and i + 1, and the lower and the upper intervals of the 1σ confidence intervals are estimated using the median, the 16th, and 84th percentiles of a sample calculated using ti + 1 − ti. To test whether the results could be affected by the inclusion of flux upper limits, we applied the same procedures to cycles 1, 2, and 5 only (i.e. cycles without upper limits in the PX,rise phases). We found the results to be consistent within 1σ uncertainties (see Table 1). The fitting results and the estimated Trecur are listed in Table 1. We also calculated the recurrence time using the PX,drop phase (Appendix B). The estimated values of Trecur are also listed in Table 1. It is clear from Fig. 2 that the Trecur of the X-ray flares in J0456−20 show rapid changes. The mass loss for each cycle marked in Fig. 2 are calculated using the method outlined in Sect. 3.3.
Results of the X-ray rising phase modelling and estimations of Trecur.
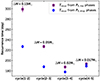 |
Fig. 2. Evolution of the recurrence time. The purple square (blue circle) points represent Trecur measured from the PX,rise (PX,drop) phases. The error bars mark the 1σ uncertainties. The upward arrow indicates the 3σ lower limit. The estimated total mass loss from the star is also marked. |
3.3. Estimation of the mass loss
Following Liu et al. (2023), a cycle is defined as the time between the start of two consecutive PX,rise phases. The total energy released in each cycle was estimated by
 (1)
(1)
where Lrs is the bolometric luminosity during the PX,rise phase, which is calculated using the best-fitting power law (see Sect. 3.2), that is,  , where κ = Lbol/LX, res0.2 − 2.0 keV is the bolometric correction factor and Dld is the luminosity distance. Then, Lpl and Lfa are the average bolometric luminosity during each of the PX,plat and PX,faint phases, respectively, while Δtfa, Δtpl, and Δtrs are the duration of the PX,faint, PX,plat, and PX,rise phases, respectively. The PX,faint phase in cycle 5 was not covered by our follow-up observations. In this work, we assumed Δtfa = 70 days for cycle 5. Liu et al. (2023) estimated the κ to be in the range of 3 − 20 during the PX,rise phase, calculated by modelling the UV to X-ray data using either the Mmcd (when J0456−20 is X-ray faint) or Comptonized Mmcd model. The Tin of the Mmcd model is around 40 − 60 eV and does not change significantly (see also Fig. 10 in Liu et al. 2023). Following Liu et al. (2023), we adopted a value of κ = 15 to calculate Lrs during the PX,rise phases. The high quality X-ray and UV data taken during the PX,plat phase of cycle 2 (the third XMM-Newton observation, hereafter X3) can be optimally fitted with a multi-coloured disk (with Tin around 60 eV) Comptonized by two coronae (XMM-Newton/X3 in Fig. 3; see also Table 3 in Liu et al. 2023 for the best-fitting results for X3). We estimated a value of κ ∼ 3 using this model. Both the X-ray and UV only show mild variability during the PX,plat phases, indicating that κ will not change significantly. We thus calculated Lpl assuming κ = 3 for the PX,plat phases. Lfa is poorly constrained. We thus estimated Lfa using the Mmcd model (Tin ∼ 45 eV) obtained by modelling the UV and X-ray emission from the first Swift observation in cycle 2 (Swift5 in Fig. 3). This model resulted in a bolometric luminosity of Lbol, sw = 9.0 × 1043 erg s−1. Considering that the peak UV magnitude in PX,faint phases is ≲0.6 mag brighter than that during the PX,rise phases, we thus conservatively estimated Lfa by multiplying Lbol, sw by a factor of 1.8, which leads to a value of 1.6 × 1044 erg s−1.
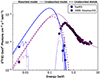 |
Fig. 3. UV to X-ray SEDs at different X-ray flux levels. The solid circles are the unfolded spectra for Swift5 (blue) and XMM-Newton/X3 (purple). The dotted lines are the absorbed models. The solid and dashed lines represent the unabsorbed intrinsic model and the diskbb component, respectively. |
The values of the parameters used to calculate Etot for each cycle can be found in Table 2. To calculate the total mass loss in each cycle, we assumed that half of the tidally disrupted debris returns to the SMBH and that the radiation efficiency is 0.1. We estimated a total released energy (mass loss) of 1.12 (0.13), 0.46 (0.05), 0.18 (0.02), 0.15 (0.017), and ≳0.12 × 1052 erg (≳0.014 M⊙) for cycles 1, 2, 3, 4, and 5, respectively. A lower limit is given for cycle 5 as the PX,plat phase could be longer then the value quoted in Table 2.
Values of the parameters used to calculate the total release energy (Etot) and mass loss (ΔM) in each cycle.
3.4. Radio variability
J0456−20 was mostly undetected after 2022 Aug., with a detection at 9 GHz on 2022 Oct. 05 and at 5.5 GHz on 2022 Oct. 07 during the PX,plat phase of cycle 4 (see Fig. 1) with a significance of 7 and 9σ, respectively. In order to improve the sensitivity, we additionally stacked the observations from October 2–7 and detected a faint point source at the coordinates of J0456−20. The radio observations reported here indicate that the transient radio source associated with the X-ray outbursts in 2022 Mar. and Apr. has also been fading, consistent with the decrease in the peak X-ray flux of each cycle (see Fig. 1). A summary of the ATCA radio observations of J0456−20 is given in Table C.1. The long-term radio light curve is shown in Fig. C.1.
4. Discussion
We detected five repeating X-ray flares in J0456−20 using the latest data. In addition, repeating transient radio emission has also been detected in J0456−20. These results provide further evidence that J0456−20 is a repeating nuclear transient, making it one of the most promising repeating pTDE candidates. More importantly, our results also revealed rapid evolution of the recurrence time Trecur, measured from the PX,rise phases, of the X-ray flares. Specifically, Trecur decreased by more than two months between cycles 1 and 2. It continued to decrease by roughly 40 days between cycles 2 and 3. Such a rapid change is likely to have ceased, as suggested by an almost constant Trecur (∼190 days) measured from the latest three cycles. Evidence for the evolution of Trecur has also been found using the values measured from the PX,drop phases (Appendix B and Table 1). However, the changes in Trecur are less dramatic than those measured from the PX,rise phases, which may attributed to the changes in the duration of the other phases (see Table 2). In this work, Trecur values derived from the PX,rise phase were used.
The evolution of Trecur has been reported only in a few repeating pTDE candidates. For instance, ASASSN-14ko showed a decrease in the periods with a period derivative of around −0.0026 (Payne et al. 2022; Huang et al. 2023), which is much shorter than that found in J0456−20 (≲ − 0.2). The X-ray flares in HLX-1 initially showed a quasi-periodic Trecur of around 1 yr. Then, Trecur increased by about one month in 2013 (Godet et al. 2014) and continued to increase until 2018, after which no X-ray outbursts were detected (Webb et al. 2023). Unlike the case of HLX-1, we found no evidence for an increase in Trecur in J0456−20 as of now. As suggested by Godet et al. (2014), the evolution of Trecur can put strong constraints on the initial mass, the mass loss, and the orbital parameters of the star.
A repeating pTDE is favoured to explain the long-term multi-wavelength light curve of J0456−20 (Liu et al. 2023). We thus performed simulations to test if the changes in Trecur, ΔP, can be explained by pTDEs. We made a grid of hydrodynamics simulations, using the moving-mesh code AREPO (Springel 2010; Weinberger et al. 2020; Pakmor et al. 2016), to examine the change in the orbital period of remnants produced in pTDEs of main-sequence stars by BHs with a mass of MBH = 105 M⊙. We considered solar-metallicity main sequence stars with masses of M⋆ = 1, 2, and 3 M⊙, and a core hydrogen mass fraction of 0.01 (terminal age) and 0.3 (middle age), evolved using the 1D stellar evolution code MESA (Paxton et al. 2013, 2015, 2019, 2011), imported into AREPO with 0.5M cells3. We also considered a wide range of the pericentre distance of rp, 0.1 ≲ rp/rt ≲ 1.2 (tidal radius rt = (MBH/M⋆)1/3R⋆), encompassing scenarios from the full disruption to no mass loss. We varied the pericentre distance for a given M⋆. Meanwhile, we fixed the orbital period of the original orbit to be 300 days, so that the stellar orbit in each simulation would have a different eccentricity (e ≳ 0.99). The initial separation between the black hole and the star is 5 rt. We followed the evolution of the remnant after the first pericentre passage of the original star, using the Helmholtz equation of state (Timmes & Swesty 2000) until the post-disruption orbital parameters do not evolve, which occurred when the separation between the black hole and the remnant is ≳5rt. We verified that the total energy in all simulations was conserved within a fractional error of ≲10−5. We note that a rapid decrease in Trecur requires a BH mass of around 105 M⊙ in our simulations, which were run with a limited range of parameter space. Our simulations with a higher BH mass of 106 M⊙ cannot reproduce Trecur observed in J0456−20. The required BH mass of 105 M⊙ is much smaller than the value quoted in Liu et al. (2023), which is around 107 M⊙. However, as cautioned in Liu et al. (2023), the values of MBH measured from the MBH − σ⋆ relation and the  relation exhibit notable differences and have large uncertainties. Thus, a MBH on the order of 105 M⊙ could still be possible for J0456−20.
Figure 4 depicts ΔP as a function of the original stellar mass, M⋆, and the fractional mass loss, ΔM/M⋆. The general trend indicates that ΔP decreases as ΔM/M⋆ increases until the fractional mass loss exceeds a critical value Δmc, roughly ≈0.7 − 0.8. Above the critical mass loss, ΔP starts to increase with ΔM/M⋆. This trend was observed for parabolic pTDEs in Ryu et al. (2020). However, the values of ΔP strongly depend on the internal structure of the star (i.e. mass and age). For pTDEs of middle age stars, ΔP is negative (positive) when ΔM/M⋆ is below (above) Δmc, meaning the remnants become more (less) bound than that of the original star before the TDE. For this case, ΔP is at most ≃ − 10 days. However, ΔP is negative across a wider range of ΔM/M⋆ and can be as large as −90 days for pTDEs of terminal age stars. Most notably, the large ΔP (i.e. ∼ − 70 days) observed in J0456−20 between cycles 1 and 2 can be reproduced if the original star is a 1 M⊙ terminal age star and loses nearly 80–90% of its mass. Although we have not explored the entire parameter space of pTDEs, our simulations suggest that the observed decrease in Trecur may be explained by a severe pTDE of a main sequence star near the terminal age. The inferred mass loss (0.8 − 0.9 M⊙) is much higher than that estimated for cycle 1 (∼0.13 M⊙, Sect. 3.3 and Table 2) of J0456−20. We note that this discrepancy can be alleviated if the radiation efficiency in J0456−20 is much lower than the assumed value of 0.1. It is important to also emphasise that our simulation result merely suggests pTDE is a plausible mechanism for generating a transient like J0456−20 and does not rule out other potential mechanisms. For instance, Linial & Quataert (2024) summarized several plausible origins for observed period evolution in repeating nuclear transients. They suggested that the period evolution in ASASSN-14ko is consistent with orbital decay induced by hydrodynamic drag as the star passes through an accretion disk (see also Zhou et al. 2024). The repeating flares in ASASSN-14ko could then be powered primarily through dragging-induced stripping of mass from the star. This scenario, however, is unlikely to be the dominant process in J0456−20, as it requires an accretion disk with mass larger than 10 M⊙ (Eq. (20) in Linial & Quataert 2024, assuming MBH = 105 M⊙) around rp to explain the observed changes in Trecur in J0456−20.
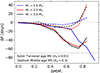 |
Fig. 4. Change in the orbital period ΔP (in days) for remnants in pTDEs of main sequence stars with mass of M⋆ = 1, 2, and 3 M⊙ in hydrodynamics simulations, as a function of the fractional mass loss ΔM/M⋆. The original stars are Solar metallicity main sequence stars with a core hydrogen mass fraction of XH ≃ 0.01 (Terminal age: solid lines) and 0.3 (Middle age: dashed lines). The simulations suggest that ΔP in severe pTDEs of terminal-age main-sequence stars can be compatible with the change in Trecur between cycles 1 and 2 (≃ − 70 days, grey horizontal line) of J0456-20. |
5. Summary
In this letter, we analyse new multi-wavelength observations for the promising repeating pTDE candidate J0456−20. We detected five repeating X-ray flares and repeating transient radio emission from J0456−20, providing additional strong evidence that J0456−20 is a repeating nuclear transient. In addition, the latest X-ray data also reveals changes in the recurrence time, Trecur, of the X-ray flare. We found that Trecur initially decreased rapidly from ∼300 days to ∼230 days and it continues to decrease by roughly 40 days per cycle, with an indication of constant values of ∼190 days in the latest cycles. Our hydrodynamic simulations show that the large decrease in Trecur can be explained in the pTDE scenario, provided that the original star is a 1 M⊙ terminal age star with an initial fractional mass loss of around 80–90%. Our results suggest that precise estimations of Trecur in repeating pTDEs can provide additional constraints on the initial mass of the disrupted star and mass loss during each passage. They also indicate that repeating pTDEs could be effective tools to probe the stellar and gas dynamics around SMBHs beyond our own Galaxy.
Note that HLX-1 is believed to be an intermediate mass black hole (IMBH) with mass of ∼104 − 5 M⊙ (Davis et al. 2011; Webb et al. 2012).
We confirmed that simulations with different resolutions between 0.25M and 1M cells yield converging ΔP.
Acknowledgments
ZL is grateful to the XMM-Newton, Swift, and NICER teams for approving the ToO/DDT requests and arranging the follow-up observations. The hydrodynamics simulations were conducted using computational resources (and/or scientific computing services) at the Max-Planck Computing & Data Facility. DH acknowledges support from DLR grant FKZ 50 OR 2003. MK is supported by DFG grant KR 3338/4-1 and DLR grant 50 OR 2307. This work was supported by the Australian government through the Australian Research Council’s Discovery Projects funding scheme (DP200102471).
References
- Arcodia, R., Merloni, A., Nandra, K., et al. 2021, Nature, 592, 704 [NASA ADS] [CrossRef] [Google Scholar]
- Arnaud, K. A. 1996, ASP Conf. Ser., 101, 17 [Google Scholar]
- Bortolas, E., Ryu, T., Broggi, L., & Sesana, A. 2023, MNRAS, 524, 3026 [NASA ADS] [CrossRef] [Google Scholar]
- CASA Team (Bean, B., et al.) 2022, PASP, 134, 114501 [NASA ADS] [CrossRef] [Google Scholar]
- Cash, W. 1979, ApJ, 228, 939 [Google Scholar]
- Cufari, M., Coughlin, E. R., & Nixon, C. J. 2022, ApJ, 929, L20 [NASA ADS] [CrossRef] [Google Scholar]
- Cufari, M., Nixon, C. J., & Coughlin, E. R. 2023, MNRAS, 520, L38 [Google Scholar]
- Davis, S. W., Narayan, R., Zhu, Y., et al. 2011, ApJ, 734, 111 [NASA ADS] [CrossRef] [Google Scholar]
- Evans, P. A., Beardmore, A. P., Page, K. L., et al. 2009, MNRAS, 397, 1177 [Google Scholar]
- Evans, P. A., Nixon, C. J., Campana, S., et al. 2023, Nat. Astron., 7, 1368 [NASA ADS] [CrossRef] [Google Scholar]
- Fruscione, A., McDowell, J. C., Allen, G. E., et al. 2006, SPIE Conf. Ser., 6270, 62701V [Google Scholar]
- Gabriel, C., Denby, M., Fyfe, D. J., et al. 2004, in Astronomical Data Analysis Software and Systems (ADASS) XIII, eds. F. Ochsenbein, M. G. Allen, & D. Egret, ASP Conf. Ser., 314, 759 [NASA ADS] [Google Scholar]
- Giustini, M., Miniutti, G., & Saxton, R. D. 2020, A&A, 636, L2 [NASA ADS] [CrossRef] [EDP Sciences] [Google Scholar]
- Godet, O., Lombardi, J. C., Antonini, F., et al. 2014, ApJ, 793, 105 [NASA ADS] [CrossRef] [Google Scholar]
- Guillochon, J., & Ramirez-Ruiz, E. 2013, ApJ, 767, 25 [NASA ADS] [CrossRef] [Google Scholar]
- Guolo, M., Pasham, D. R., Zajaček, M., et al. 2024, Nat. Astron., https://doi.org/10.1038/s41550-023-02178-4 [Google Scholar]
- Hayasaki, K., Stone, N., & Loeb, A. 2013, MNRAS, 434, 909 [NASA ADS] [CrossRef] [Google Scholar]
- Huang, S., Jiang, N., Shen, R.-F., Wang, T., & Sheng, Z. 2023, ApJ, 956, L46 [NASA ADS] [CrossRef] [Google Scholar]
- Krolik, J., Piran, T., & Ryu, T. 2020, ApJ, 904, 68 [NASA ADS] [CrossRef] [Google Scholar]
- Linial, I., & Quataert, E. 2024, MNRAS, 527, 4317 [Google Scholar]
- Liu, Z., Malyali, A., Krumpe, M., et al. 2023, A&A, 669, A75 [NASA ADS] [CrossRef] [EDP Sciences] [Google Scholar]
- Malyali, A., Liu, Z., Rau, A., et al. 2023, MNRAS, 520, 3549 [NASA ADS] [CrossRef] [Google Scholar]
- Melchor, D., Mockler, B., Naoz, S., Rose, S. C., & Ramirez-Ruiz, E. 2024, ApJ, 960, 39 [NASA ADS] [CrossRef] [Google Scholar]
- Miniutti, G., Saxton, R. D., Giustini, M., et al. 2019, Nature, 573, 381 [Google Scholar]
- Miniutti, G., Giustini, M., Arcodia, R., et al. 2023, A&A, 670, A93 [NASA ADS] [CrossRef] [EDP Sciences] [Google Scholar]
- Nixon, C. J., & Coughlin, E. R. 2022, ApJ, 927, L25 [NASA ADS] [CrossRef] [Google Scholar]
- Pakmor, R., Springel, V., Bauer, A., et al. 2016, MNRAS, 455, 1134 [Google Scholar]
- Paxton, B., Bildsten, L., Dotter, A., et al. 2011, ApJS, 192, 3 [Google Scholar]
- Paxton, B., Cantiello, M., Arras, P., et al. 2013, ApJS, 208, 4 [Google Scholar]
- Paxton, B., Marchant, P., Schwab, J., et al. 2015, ApJS, 220, 15 [Google Scholar]
- Paxton, B., Smolec, R., Schwab, J., et al. 2019, ApJS, 243, 10 [Google Scholar]
- Payne, A. V., Shappee, B. J., Hinkle, J. T., et al. 2021, ApJ, 910, 125 [NASA ADS] [CrossRef] [Google Scholar]
- Payne, A. V., Shappee, B. J., Hinkle, J. T., et al. 2022, ApJ, 926, 142 [NASA ADS] [CrossRef] [Google Scholar]
- Planck Collaboration VI. 2020, A&A, 641, A6 [NASA ADS] [CrossRef] [EDP Sciences] [Google Scholar]
- Ryu, T., Krolik, J., Piran, T., & Noble, S. C. 2020, ApJ, 904, 100 [NASA ADS] [CrossRef] [Google Scholar]
- Springel, V. 2010, MNRAS, 401, 791 [Google Scholar]
- Strüder, L., Briel, U., Dennerl, K., et al. 2001, A&A, 365, L18 [Google Scholar]
- Timmes, F. X., & Swesty, F. D. 2000, ApJS, 126, 501 [NASA ADS] [CrossRef] [Google Scholar]
- Turner, M. J. L., Abbey, A., Arnaud, M., et al. 2001, A&A, 365, L27 [CrossRef] [EDP Sciences] [Google Scholar]
- Webb, N., Cseh, D., Lenc, E., et al. 2012, Science, 337, 554 [NASA ADS] [CrossRef] [Google Scholar]
- Webb, N. A., Barret, D., Godet, O., et al. 2023, Astron. Nachr., 344, e20230051 [Google Scholar]
- Weinberger, R., Springel, V., & Pakmor, R. 2020, ApJS, 248, 32 [Google Scholar]
- Wevers, T., Coughlin, E. R., Pasham, D. R., et al. 2023, ApJ, 942, L33 [NASA ADS] [CrossRef] [Google Scholar]
- Zhou, C., Huang, L., Guo, K., Li, Y. P., & Pan, Z. 2024, ArXiv e-prints [arXiv:2401.11190] [Google Scholar]
Appendix A: Chandra astrometric correction
We ran the WAVDETECT tool on the Chandra data to generate a source list for each observation. J0456−20was detected in all the three Chandra observations. We used the source positions provided in the Legacy Survey DR10 catalogue as a reference. The overall 90% absolute astrometry uncertainty of Chandra is ∼1.11 arcsec4. We thus cross-matched the positions of the X-ray source measured from the Chandra observations with the source positions listed in the DR10 catalogue using a radius of 1.1 arcsec. We selected sources within 3 arcmin of the aimpoint of the telescope. This resulted in three sources (excluding J0456−20, see A.1) that are detected in both X-ray and DR10 in the second Chandra observation (only two for the other two observations). The CIAO task WCS_MATCH and WCS_UPDATE were then used to correct and update the aspect ratio. The residual rms scatter in the corrected X-ray positions of the LS10 sources is 0.28 arcsec, which corresponds to a 2σ position error of ≈0.54 arcsec (assuming Rayleigh distribution). The astrometric corrected Chandra position is consistent with the centre of the host galaxy (see Fig. A.1).
Astrometric corrections for Chandra observations.
 |
Fig. A.1. Updated multi-wavelength positions of J0456−20. The black dot marks the position given in the Gaia EDR3. The crosses represent the positions measured from different instruments, and the circles indicate the 2σ positional uncertainties: Swift/UVOT (green, 2σ = 0.52″), Chandra (red, 2σ = 0.54″), ATCA (white, 2σ = 1.0″), XMM-Newton (royalblue, 2σ = 1.6″), and eRASS3 (orange, 2σ = 2.0″). |
Appendix B: Estimation of the recurrence time using the X-ray drop phase
The recurrence time can also be determined using the PX, drop phases. The start dates of the PX, drop phases, ts, drop, can be well constrained in a model-independent way due to their short duration (i.e. fX, soft drops by a factor of ≳10 within one week). We estimated ts, drop in the range of MJD [59285, 59291], [59512, 59518], and [59699, 59706], and [59878, 59883] for cycles 1, 2, 3, and 4, respectively. The PX, drop phase was not observed in cycle 5 because J0456−20was blocked by the Sun. However, a lower limit of > MJD 60072 can be given. We generated 105 realisations of ts, drop for each cycle in cycles 1–4, assuming uniform distributions of ts, drop in the estimated MJD ranges. Trecur and the 1σ intervals can be estimated using the median and the 16th and 84th percentiles of the difference between consecutive ts, drop for cycles 1–4. We calculated a 3σ upper limit of 189 days for Trecur between cycles 4 and 5. The estimated Trecur values are listed in Table 1.
Appendix C: Details of the radio and X-ray observations
Table C.1 lists the ATCA radio observations for J0456−20. J0456−20was detected only in the PX, plat phase during cycles 3 and 4. The long-term radio variability is shown in Fig. C.1.
The details of the X-ray observations and the X-ray spectral fitting results are listed in Table C.2.
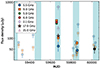 |
Fig. C.1. Evolution of the radio flux density. The error bars mark the 1σ uncertainties. The downward arrows represent the 3σ upper limits. The black circle shows the flux density at 5.5 GHz measured from the stacked observation from 2023 Mar. The light cyan regions indicate the PX, plat phase in each cycle. |
ATCA radio observations of J0456−20
Log of X-ray observations.
All Tables
Values of the parameters used to calculate the total release energy (Etot) and mass loss (ΔM) in each cycle.
All Figures
|
Fig. 1. Long-term X-ray and UV light curves for J0456−20. The coloured regions represent the four phases: the plateau phase (PX,plat, light cyan), the rapid drop phase (PX,drop, light blue), the faint phase (PX,faint, light yellow), and the rising phase (PX,rise, light green). Upper panel: red points with error bars are the unabsorbed rest-frame 0.2 − 2.0 keV X-ray light curve from eROSITA (hexagons), Swift/XRT (squares), NICER (circles), XMM-Newton (stars), and Chandra (diamonds). The error bars indicate 90% uncertainties. The points with downward arrows represent the 3σ flux and luminosity upper limits. The points with blue colour are the data used to model the profiles of the PX,rise phase. The green dashed lines show the best-fitting power-law model for the five X-ray rising phases. The grey shaded regions mark the 1σ uncertainty of the model. Bottom panel: UV light curve from Swift/UVOT UVM2 (red squares). The error bars mark the 1σ uncertainties. Squares with downward arrows indicate 3σ upper limits. The vertical lines mark the dates of the ATCA radio observations (black dashed-dotted: non-detections; blue dashed: detections). |
| In the text | |
|
Fig. 2. Evolution of the recurrence time. The purple square (blue circle) points represent Trecur measured from the PX,rise (PX,drop) phases. The error bars mark the 1σ uncertainties. The upward arrow indicates the 3σ lower limit. The estimated total mass loss from the star is also marked. |
| In the text | |
|
Fig. 3. UV to X-ray SEDs at different X-ray flux levels. The solid circles are the unfolded spectra for Swift5 (blue) and XMM-Newton/X3 (purple). The dotted lines are the absorbed models. The solid and dashed lines represent the unabsorbed intrinsic model and the diskbb component, respectively. |
| In the text | |
|
Fig. 4. Change in the orbital period ΔP (in days) for remnants in pTDEs of main sequence stars with mass of M⋆ = 1, 2, and 3 M⊙ in hydrodynamics simulations, as a function of the fractional mass loss ΔM/M⋆. The original stars are Solar metallicity main sequence stars with a core hydrogen mass fraction of XH ≃ 0.01 (Terminal age: solid lines) and 0.3 (Middle age: dashed lines). The simulations suggest that ΔP in severe pTDEs of terminal-age main-sequence stars can be compatible with the change in Trecur between cycles 1 and 2 (≃ − 70 days, grey horizontal line) of J0456-20. |
| In the text | |
|
Fig. A.1. Updated multi-wavelength positions of J0456−20. The black dot marks the position given in the Gaia EDR3. The crosses represent the positions measured from different instruments, and the circles indicate the 2σ positional uncertainties: Swift/UVOT (green, 2σ = 0.52″), Chandra (red, 2σ = 0.54″), ATCA (white, 2σ = 1.0″), XMM-Newton (royalblue, 2σ = 1.6″), and eRASS3 (orange, 2σ = 2.0″). |
| In the text | |
|
Fig. C.1. Evolution of the radio flux density. The error bars mark the 1σ uncertainties. The downward arrows represent the 3σ upper limits. The black circle shows the flux density at 5.5 GHz measured from the stacked observation from 2023 Mar. The light cyan regions indicate the PX, plat phase in each cycle. |
| In the text | |
Current usage metrics show cumulative count of Article Views (full-text article views including HTML views, PDF and ePub downloads, according to the available data) and Abstracts Views on Vision4Press platform.
Data correspond to usage on the plateform after 2015. The current usage metrics is available 48-96 hours after online publication and is updated daily on week days.
Initial download of the metrics may take a while.