Fig. 1.
Download original image
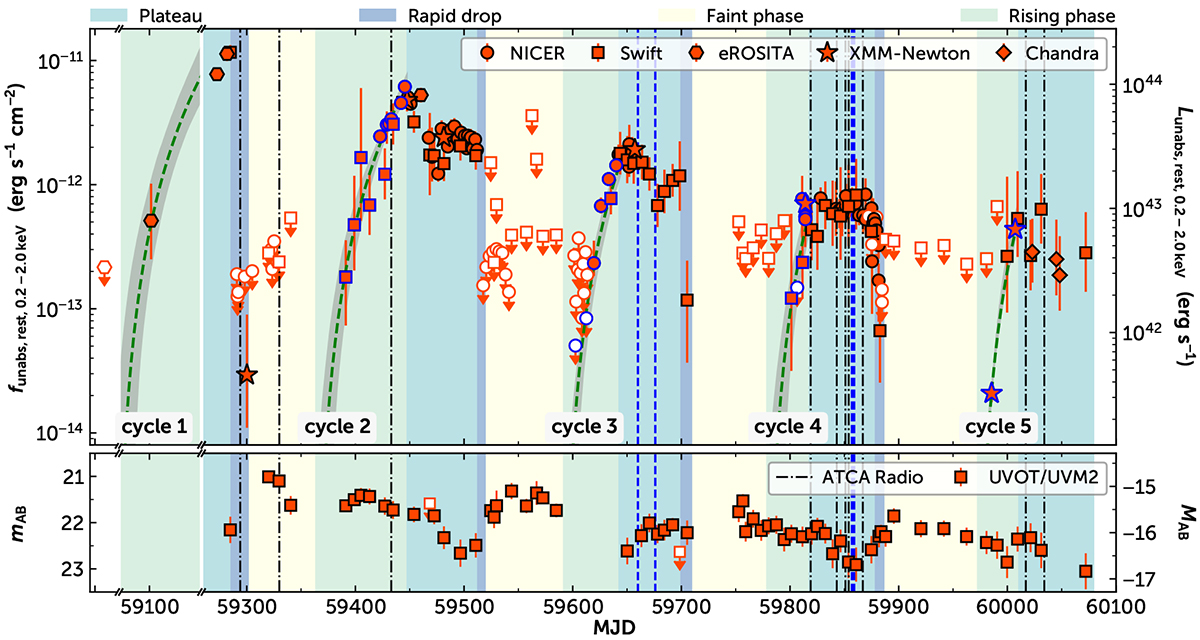
Long-term X-ray and UV light curves for J0456−20. The coloured regions represent the four phases: the plateau phase (PX,plat, light cyan), the rapid drop phase (PX,drop, light blue), the faint phase (PX,faint, light yellow), and the rising phase (PX,rise, light green). Upper panel: red points with error bars are the unabsorbed rest-frame 0.2 − 2.0 keV X-ray light curve from eROSITA (hexagons), Swift/XRT (squares), NICER (circles), XMM-Newton (stars), and Chandra (diamonds). The error bars indicate 90% uncertainties. The points with downward arrows represent the 3σ flux and luminosity upper limits. The points with blue colour are the data used to model the profiles of the PX,rise phase. The green dashed lines show the best-fitting power-law model for the five X-ray rising phases. The grey shaded regions mark the 1σ uncertainty of the model. Bottom panel: UV light curve from Swift/UVOT UVM2 (red squares). The error bars mark the 1σ uncertainties. Squares with downward arrows indicate 3σ upper limits. The vertical lines mark the dates of the ATCA radio observations (black dashed-dotted: non-detections; blue dashed: detections).
Current usage metrics show cumulative count of Article Views (full-text article views including HTML views, PDF and ePub downloads, according to the available data) and Abstracts Views on Vision4Press platform.
Data correspond to usage on the plateform after 2015. The current usage metrics is available 48-96 hours after online publication and is updated daily on week days.
Initial download of the metrics may take a while.