Open Access
Fig. 2.
Download original image
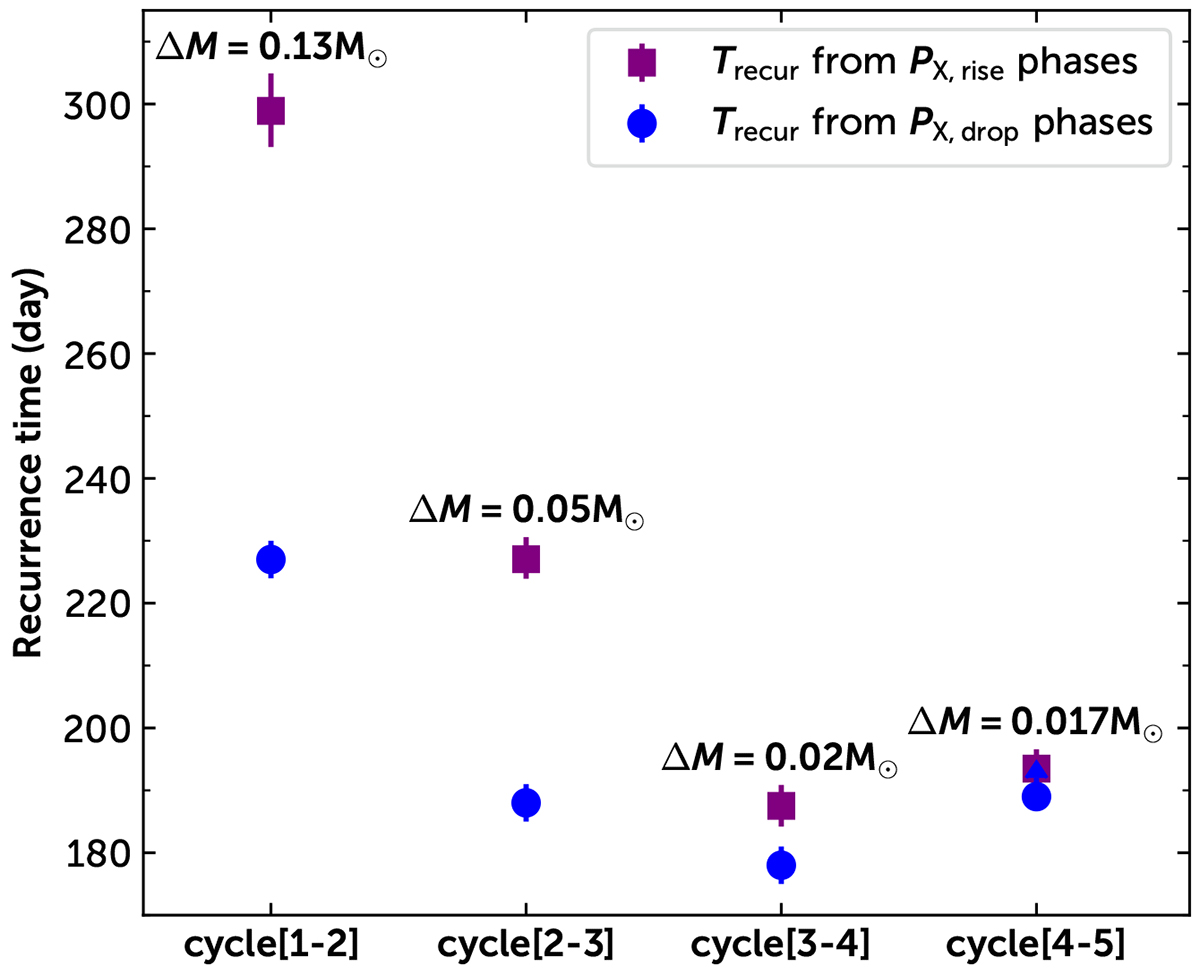
Evolution of the recurrence time. The purple square (blue circle) points represent Trecur measured from the PX,rise (PX,drop) phases. The error bars mark the 1σ uncertainties. The upward arrow indicates the 3σ lower limit. The estimated total mass loss from the star is also marked.
Current usage metrics show cumulative count of Article Views (full-text article views including HTML views, PDF and ePub downloads, according to the available data) and Abstracts Views on Vision4Press platform.
Data correspond to usage on the plateform after 2015. The current usage metrics is available 48-96 hours after online publication and is updated daily on week days.
Initial download of the metrics may take a while.