Fig. 8.
Download original image
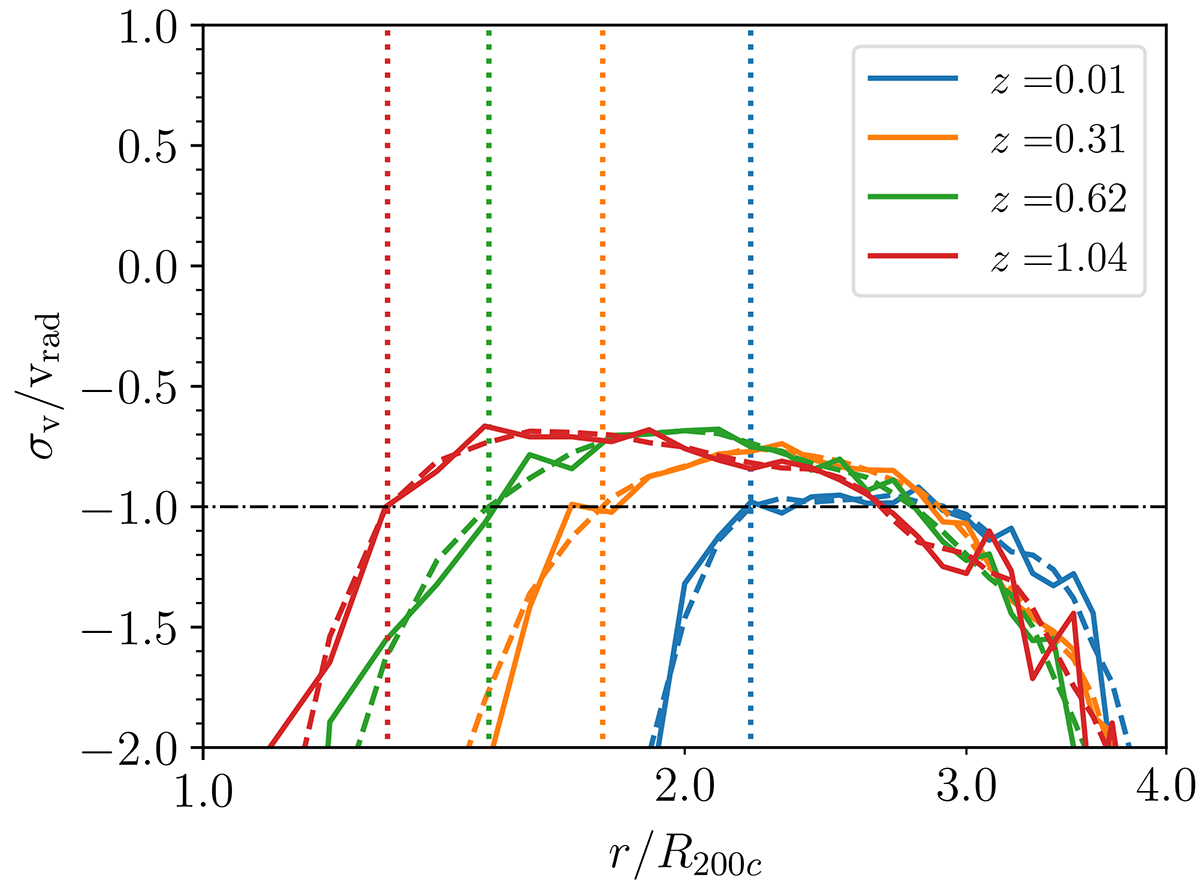
Average ratio between the galaxy velocity dispersion and the galaxy radial velocity, as a function of cluster-centric radius. The blue, orange, green, and red solid curves show the ratio at four redshifts z = 0.01, 0.31, 0.62, and 1.04, respectively. The dashed curves show the smoothed correspondingly colored solid curves. The horizontal dash-dotted line shows σv/vrad = −1. The vertical dotted lines show Rσv corresponding to σv(r)/vrad(r) = − 1 from smoothed profiles.
Current usage metrics show cumulative count of Article Views (full-text article views including HTML views, PDF and ePub downloads, according to the available data) and Abstracts Views on Vision4Press platform.
Data correspond to usage on the plateform after 2015. The current usage metrics is available 48-96 hours after online publication and is updated daily on week days.
Initial download of the metrics may take a while.