Fig. 5.
Download original image
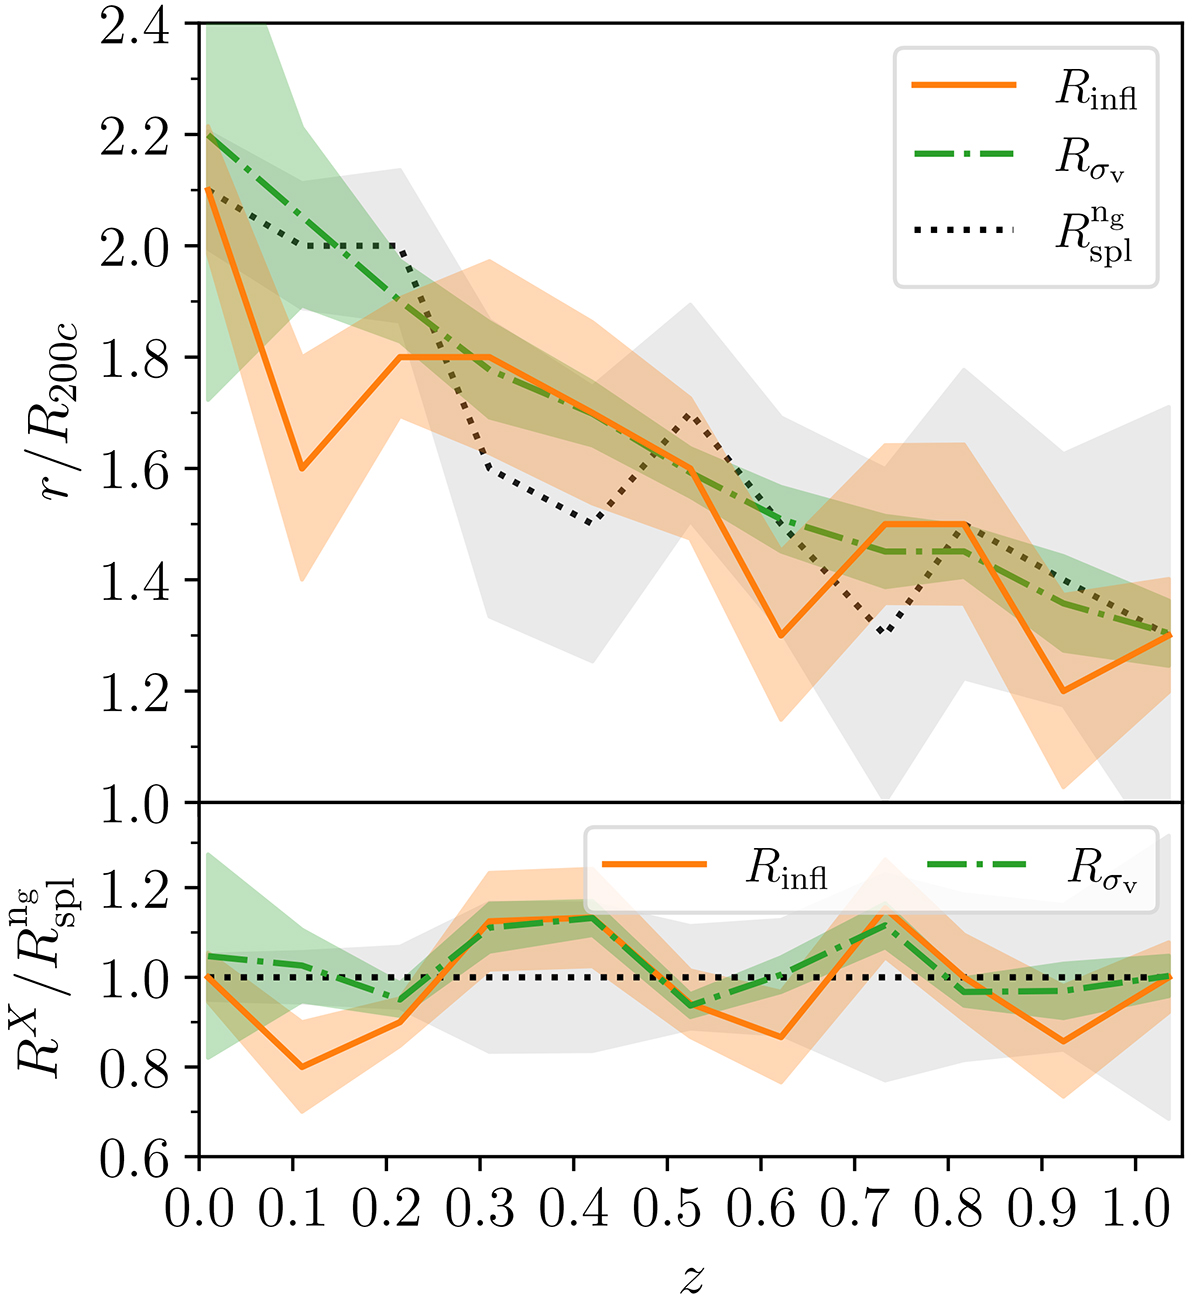
Dynamical radii from cluster galaxy velocity in the splashback region. Upper panel: The solid orange, dash-dotted green, and dotted black lines show Rinfl, Rσv, and ![]() , respectively. The shadowed areas show the associated standard deviations. Bottom panel: The solid orange and dash-dotted green lines show the ratio between Rinfl and
, respectively. The shadowed areas show the associated standard deviations. Bottom panel: The solid orange and dash-dotted green lines show the ratio between Rinfl and ![]() , and between Rσv and
, and between Rσv and ![]() , respectively. The dotted line shows equality. The orange, green, and grey shadowed areas show the 1σ confidence levels for each ratio with the corresponding color.
, respectively. The dotted line shows equality. The orange, green, and grey shadowed areas show the 1σ confidence levels for each ratio with the corresponding color.
Current usage metrics show cumulative count of Article Views (full-text article views including HTML views, PDF and ePub downloads, according to the available data) and Abstracts Views on Vision4Press platform.
Data correspond to usage on the plateform after 2015. The current usage metrics is available 48-96 hours after online publication and is updated daily on week days.
Initial download of the metrics may take a while.