Open Access
Fig. 4.
Download original image
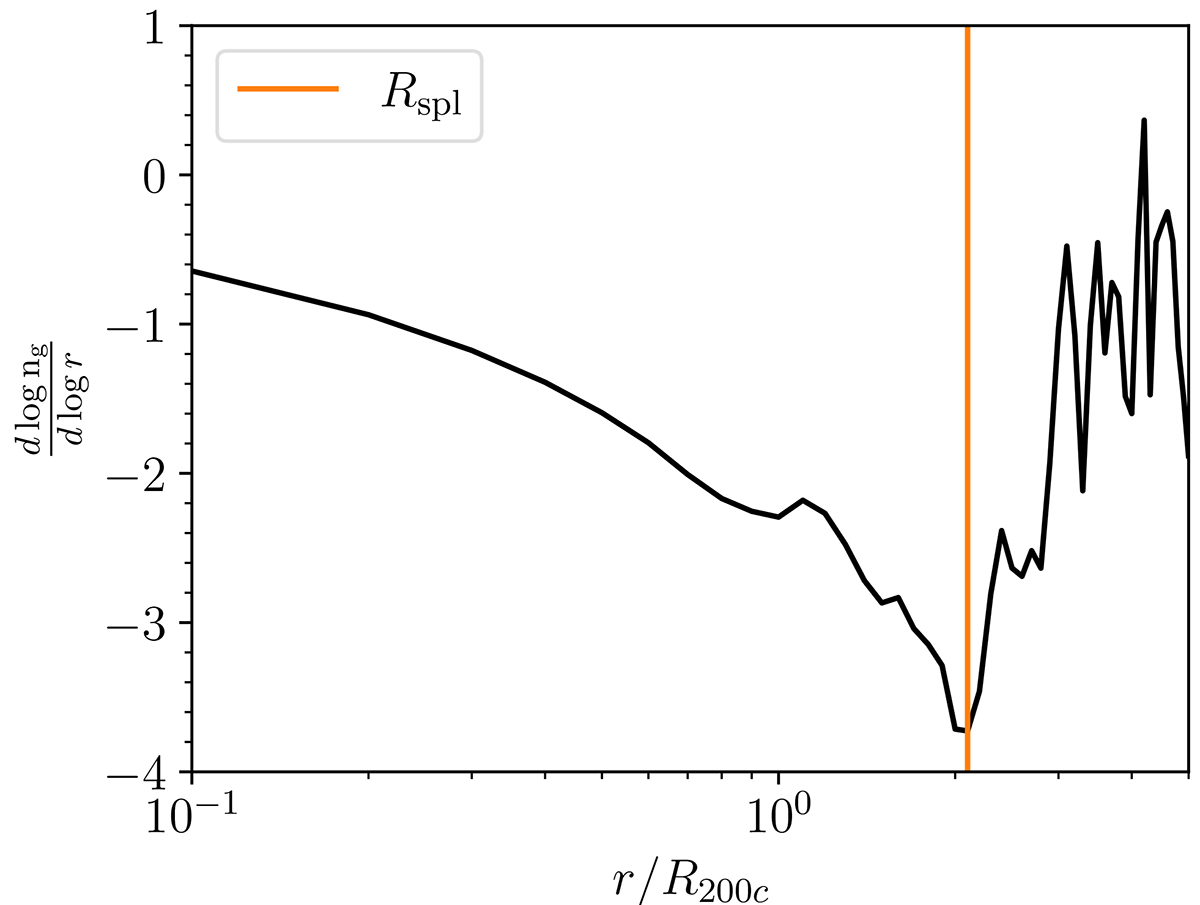
Splashback radius from ng. The curve shows the smoothed logarithmic slope of the average local galaxy number density of the 282 clusters at z = 0.01. The orange vertical line shows the minimum, ![]() .
.
Current usage metrics show cumulative count of Article Views (full-text article views including HTML views, PDF and ePub downloads, according to the available data) and Abstracts Views on Vision4Press platform.
Data correspond to usage on the plateform after 2015. The current usage metrics is available 48-96 hours after online publication and is updated daily on week days.
Initial download of the metrics may take a while.