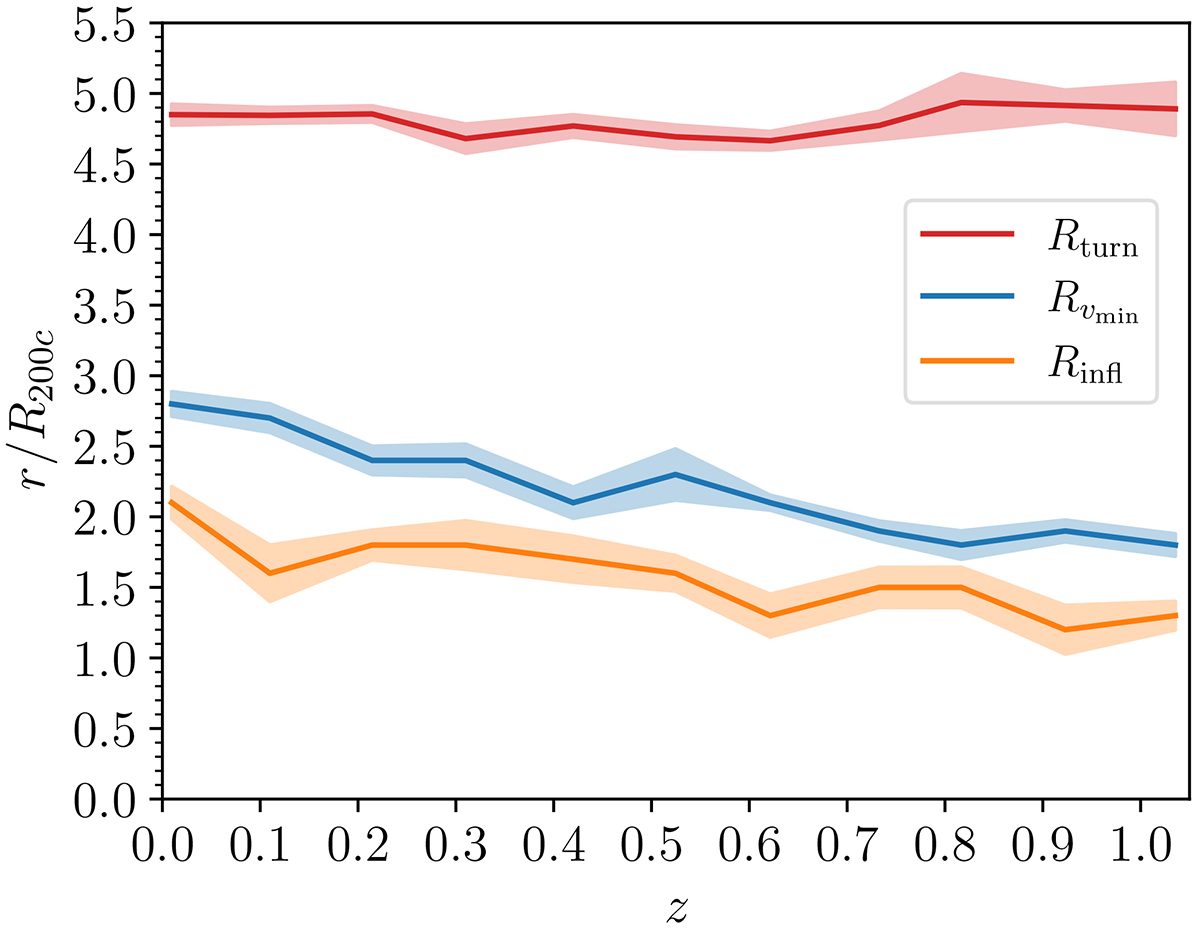
Fig. 3.
Download original image
Dynamical radii from smoothed average galaxy radial velocity profiles. The red, blue, and orange lines show the mass averaged turnaround radius (Sect. 3.1), the point of minimum vrad(r) (Sect. 3.2), and the inflection point of vrad(r) (Sect. 3.3), as a function of redshift, respectively. Shadowed bands show the error from bootstrap resampling of the correspondingly colored radius.
Current usage metrics show cumulative count of Article Views (full-text article views including HTML views, PDF and ePub downloads, according to the available data) and Abstracts Views on Vision4Press platform.
Data correspond to usage on the plateform after 2015. The current usage metrics is available 48-96 hours after online publication and is updated daily on week days.
Initial download of the metrics may take a while.