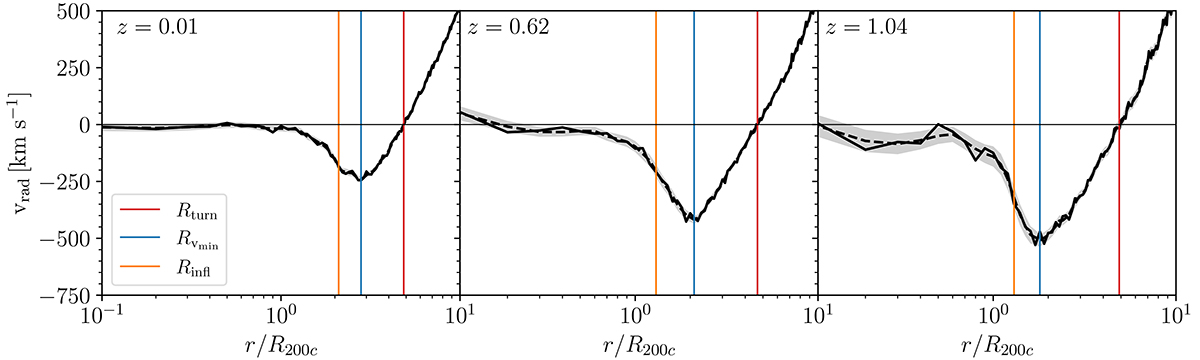
Fig. 2.
Download original image
Average radial velocity profiles and dynamical radii. Solid curves show the average galaxy radial velocity profiles of clusters at three redshifts: z = 0.01, 0.62, and 1.04, from left to right, respectively. Dashed curves show the Savitzky–Golay (Savitzky & Golay 1964) smoothed profiles. Shaded bands show the error in the smoothed profiles. In each panel, the red, blue, and orange lines show the turnaround, the minimum radial velocity, and the inflection point radii, respectively, derived from the average radial velocity profiles (see Sect. 3).
Current usage metrics show cumulative count of Article Views (full-text article views including HTML views, PDF and ePub downloads, according to the available data) and Abstracts Views on Vision4Press platform.
Data correspond to usage on the plateform after 2015. The current usage metrics is available 48-96 hours after online publication and is updated daily on week days.
Initial download of the metrics may take a while.