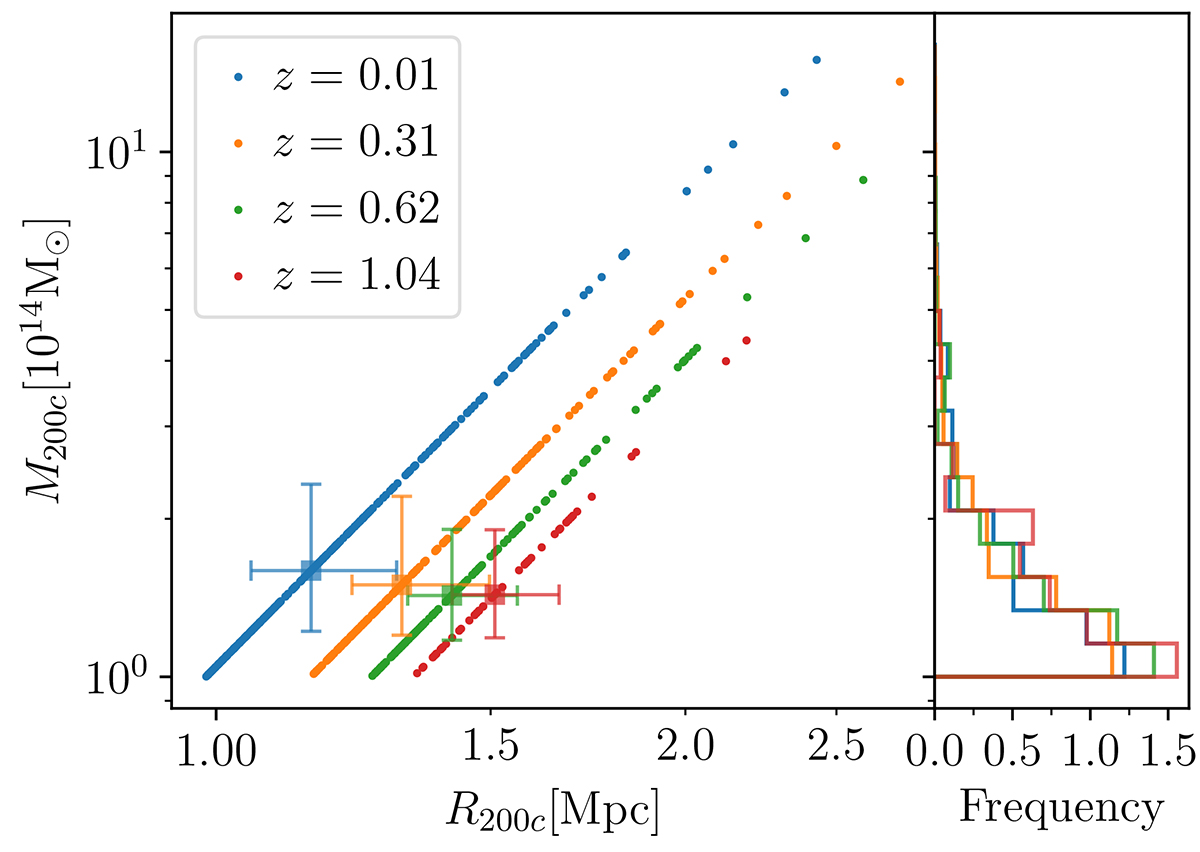
Fig. 1.
Download original image
Relation between M200c and comoving R200c for IllustrisTNG clusters. Left panel: Blue, orange, green, and red points show the M200c − R200c relation for clusters in four redshift bins z = 0.01, 0.31, 0.62, and z = 1.04, respectively. Colored squares with error bars show the median and interquartile range in each redshift bin. Right panel: Mass distribution histograms, with areas normalized to unity.
Current usage metrics show cumulative count of Article Views (full-text article views including HTML views, PDF and ePub downloads, according to the available data) and Abstracts Views on Vision4Press platform.
Data correspond to usage on the plateform after 2015. The current usage metrics is available 48-96 hours after online publication and is updated daily on week days.
Initial download of the metrics may take a while.