Fig. 8.
Download original image
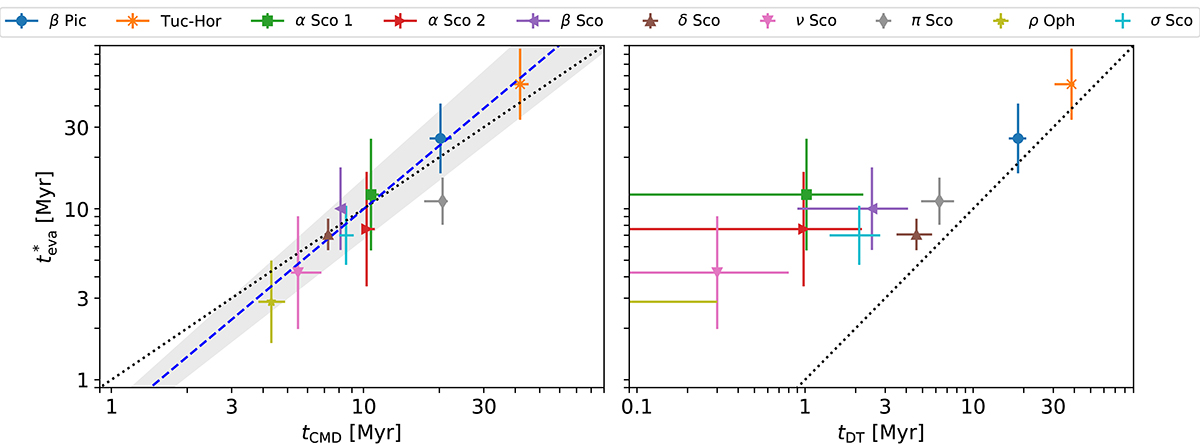
Comparison of the corrected evaporation ages, ![]() , with the color–magnitude diagram ages, tCMD, and the dynamical traceback ages, tDT. The dotted black line is one-to-one line, showing that the evaporation ages are in general agreement with the CMD ages, but the DT ages are clearly offset. On the left panel, the blue dashed line is a least-squares fit to the data (except for π Sco) in logarithmic space,
, with the color–magnitude diagram ages, tCMD, and the dynamical traceback ages, tDT. The dotted black line is one-to-one line, showing that the evaporation ages are in general agreement with the CMD ages, but the DT ages are clearly offset. On the left panel, the blue dashed line is a least-squares fit to the data (except for π Sco) in logarithmic space, ![]() , with the shaded region showing the 1-sigma confidence of the fit. Apart from the youngest ages at < 3 Myr, the 1-to-1 line is still within the shaded region. The values used and references can be found in Table 1. The tCMD and tDT ages of α Sco 1 and 2 have been shifted right and left by a factor of 1.02 to prevent the error bars from overlapping; the age reported in the table is in between. On the right panel, the symbol for ρ Oph is out of the plot to the left, as it has tDT = 0.
, with the shaded region showing the 1-sigma confidence of the fit. Apart from the youngest ages at < 3 Myr, the 1-to-1 line is still within the shaded region. The values used and references can be found in Table 1. The tCMD and tDT ages of α Sco 1 and 2 have been shifted right and left by a factor of 1.02 to prevent the error bars from overlapping; the age reported in the table is in between. On the right panel, the symbol for ρ Oph is out of the plot to the left, as it has tDT = 0.
Current usage metrics show cumulative count of Article Views (full-text article views including HTML views, PDF and ePub downloads, according to the available data) and Abstracts Views on Vision4Press platform.
Data correspond to usage on the plateform after 2015. The current usage metrics is available 48-96 hours after online publication and is updated daily on week days.
Initial download of the metrics may take a while.