Open Access
Fig. 7.
Download original image
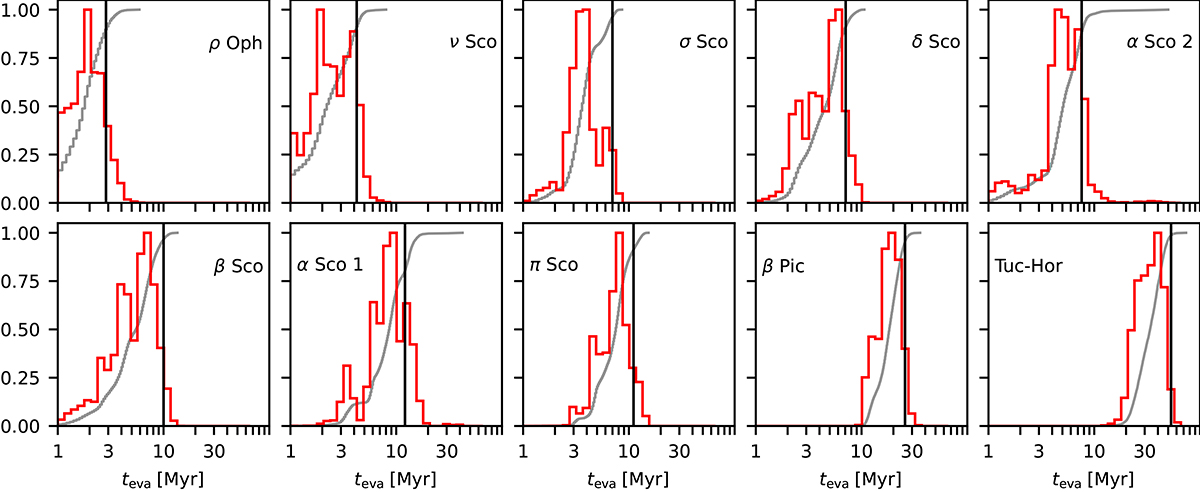
Histograms (peaks scaled to 1.0) of the evaporation ages of individual evaporated stars (red histograms) and the corresponding cumulative distributions (gray curves), from the 1000 Monte-Carlo error realizations and using stellar orbits computed with MWPotential14. The derived ![]() is shown by the vertical black lines.
is shown by the vertical black lines.
Current usage metrics show cumulative count of Article Views (full-text article views including HTML views, PDF and ePub downloads, according to the available data) and Abstracts Views on Vision4Press platform.
Data correspond to usage on the plateform after 2015. The current usage metrics is available 48-96 hours after online publication and is updated daily on week days.
Initial download of the metrics may take a while.