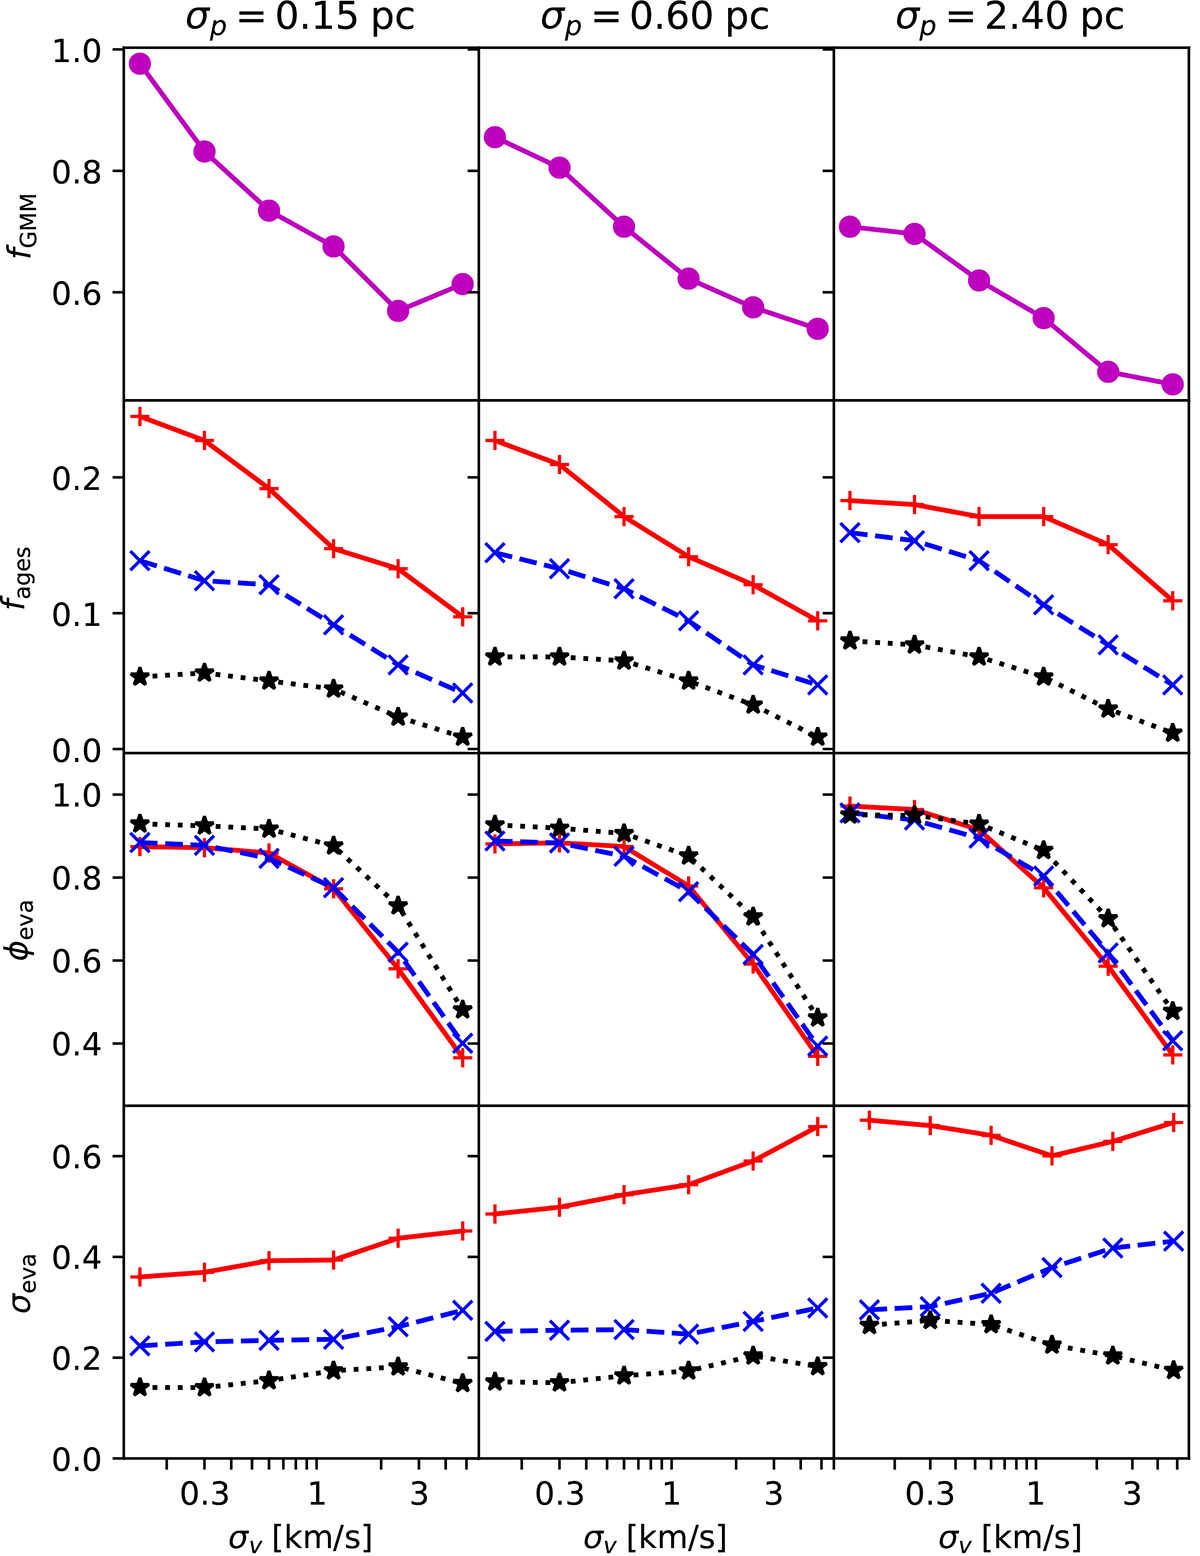
Fig. 5.
Download original image
Impact of the observational errors. Top row: fraction of GMM clusters, fGMM, derived from the number of clusters found by GMM in each error pair, divided by the number of GMM clusters in the no errors case (339). Second row: fraction of clusters for which we derived ages, fages, normalized to 339. Red, blue, and black lines are for neva, 70 bins of 5–9, 10–19, and 20+ stars, respectively. Third row: ϕeva. Bottom row: σeva. Columns correspond to different 3D position errors, σp, and the x-axis is the 3D velocity error, σv.
Current usage metrics show cumulative count of Article Views (full-text article views including HTML views, PDF and ePub downloads, according to the available data) and Abstracts Views on Vision4Press platform.
Data correspond to usage on the plateform after 2015. The current usage metrics is available 48-96 hours after online publication and is updated daily on week days.
Initial download of the metrics may take a while.