Fig. 3.
Download original image
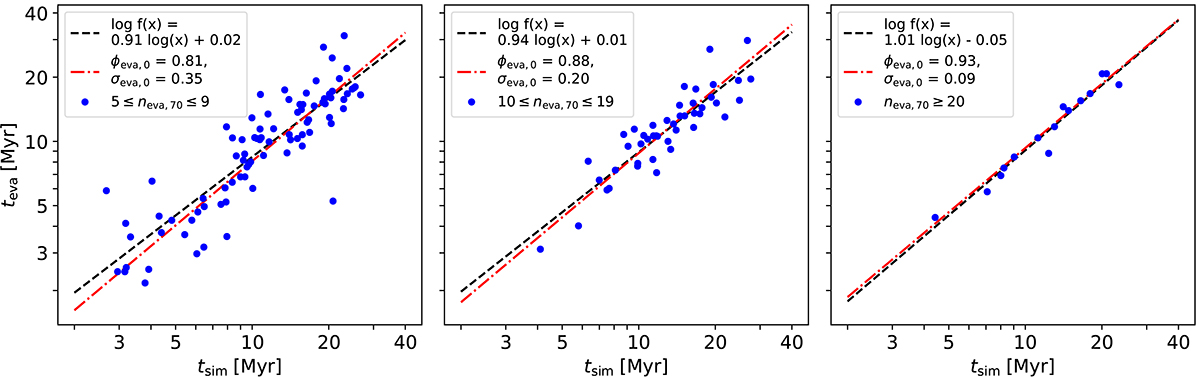
Evaporation age, teva, versus simulation age, tsim, for the clusters in the simulation within three different bins of the number of stars, neva, 70, from which the evaporation age was calculated. The left panel has 86 clusters, the middle one has 45 clusters, and the right one has 15 clusters. The dashdot red line corresponds to ϕeva, 0 tsim, where ϕeva, 0 is the median value of the age ratio teva/tsim (Eq. (1)) in each bin. The scatter, σeva, 0, is the standard deviation of the ratio of the corrected ![]() (see Eq. (2)) of the individual clusters with respect to their tsim, as explained in Eq. (3). The black dashed line is a least-squares fit, f(x), showing that the slope is very close to unity and thus ϕeva, 0 does not depend on the age of the cluster.
(see Eq. (2)) of the individual clusters with respect to their tsim, as explained in Eq. (3). The black dashed line is a least-squares fit, f(x), showing that the slope is very close to unity and thus ϕeva, 0 does not depend on the age of the cluster.
Current usage metrics show cumulative count of Article Views (full-text article views including HTML views, PDF and ePub downloads, according to the available data) and Abstracts Views on Vision4Press platform.
Data correspond to usage on the plateform after 2015. The current usage metrics is available 48-96 hours after online publication and is updated daily on week days.
Initial download of the metrics may take a while.