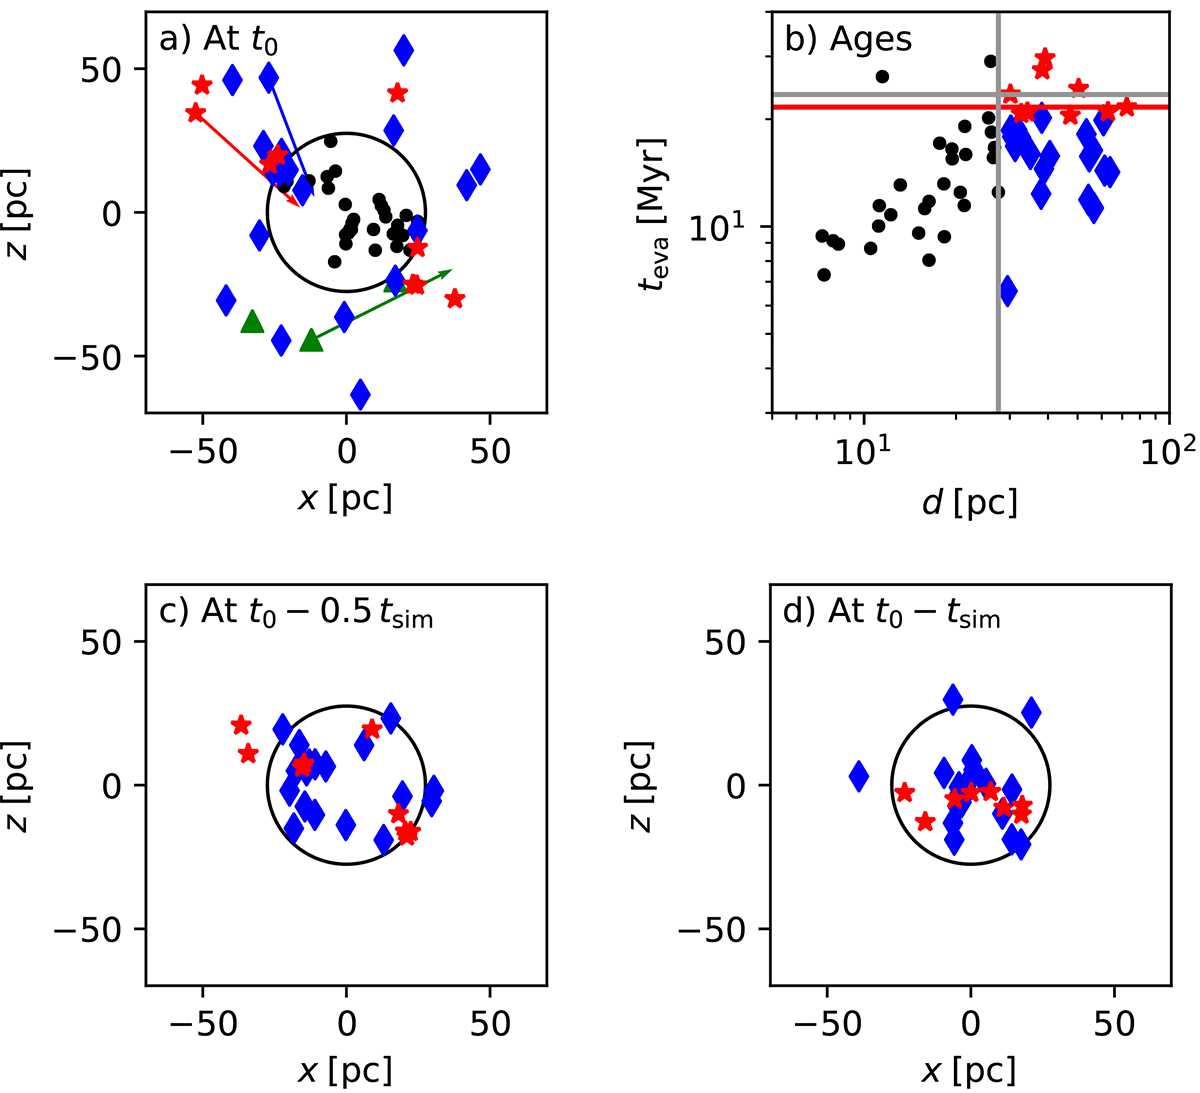
Fig. 2.
Download original image
Example of the application of the evaporation-age method to a simulated cluster. a) Projected xz positions of the cluster members in the present (t0). Green triangles are initial cluster members rejected because they do not trace back into the cluster core (black circle). Black dots are cluster members in the cluster core in the present. Blue diamonds and red stars are evaporated cluster members. They are currently outside the cluster core but were inside in the past. Vectors show the 2D projected velocities back in time. b) The diagram illustrating the evaporation age determination. The x-axis is the current distance from the cluster center, d, with the gray vertical line showing the current core radius of the cluster, and the y-axis is the evaporation age, teva, for each star. Red stars are evaporated stars with teva higher than the 70th percentile of the teva distribution, and the red line is the median teva for these stars. Blue diamonds are evaporated stars with teva lower than the 70th percentile and are not used for the evaporation age determination. The gray horizontal line is the simulation age of the cluster, tsim. c) Projected XZ positions of evaporated stars at half tsim. d) Positions of evaporated stars at the beginning of the cluster. Only 50% of all the cluster stars had been born by this time.
Current usage metrics show cumulative count of Article Views (full-text article views including HTML views, PDF and ePub downloads, according to the available data) and Abstracts Views on Vision4Press platform.
Data correspond to usage on the plateform after 2015. The current usage metrics is available 48-96 hours after online publication and is updated daily on week days.
Initial download of the metrics may take a while.