Fig. 1.
Download original image
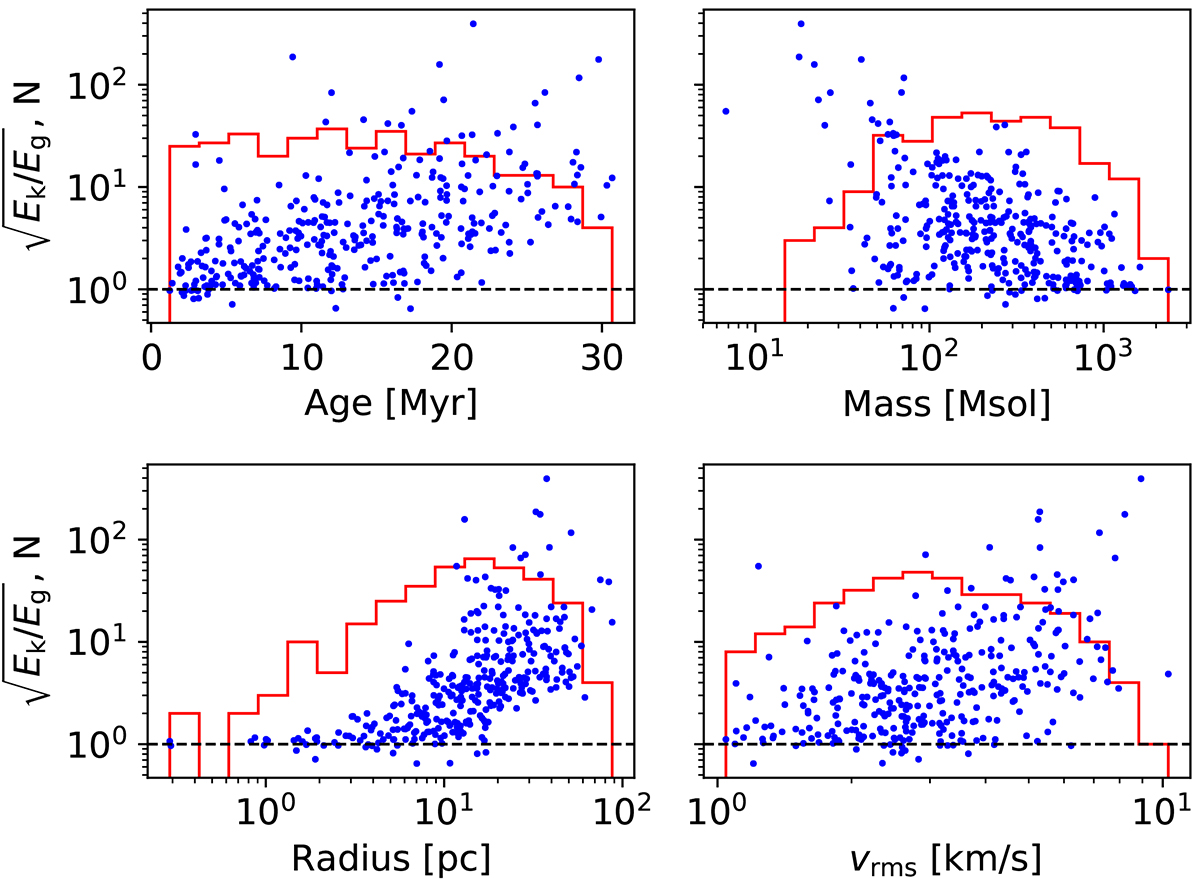
Histograms (in red) of the ages, masses, radius, and rms velocities and scatter plots of the square root (to use the same scale as the histograms) of the ratio of kinetic and gravitational energies versus the same quantities (blue dots) of the 339 clusters identified in the six simulation snapshots used in this work. The black dashed line marks the value of Ek = Eg, showing that 5% of the clusters (17 of them) are gravitationally bound.
Current usage metrics show cumulative count of Article Views (full-text article views including HTML views, PDF and ePub downloads, according to the available data) and Abstracts Views on Vision4Press platform.
Data correspond to usage on the plateform after 2015. The current usage metrics is available 48-96 hours after online publication and is updated daily on week days.
Initial download of the metrics may take a while.