Fig. 2
Download original image
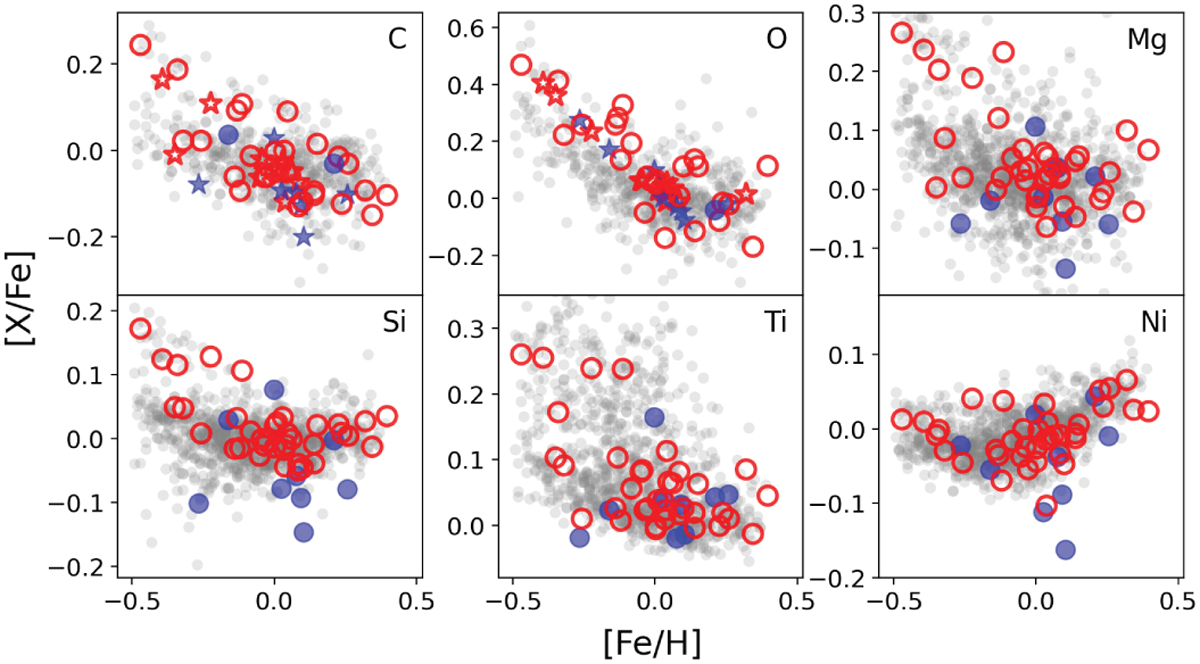
Abundance ratios ([X/Fe]) as a function of metallicity for the sample stars. The blue and red symbols represent planets with TTV and RV mass determinations, respectively. The star symbols indicate the abundances predicted using the ML method, and the circles represent the spectroscopic determinations. The gray dots represent stars without planets from the HARPS GTO sample (Adibekyan et al. 2012).
Current usage metrics show cumulative count of Article Views (full-text article views including HTML views, PDF and ePub downloads, according to the available data) and Abstracts Views on Vision4Press platform.
Data correspond to usage on the plateform after 2015. The current usage metrics is available 48-96 hours after online publication and is updated daily on week days.
Initial download of the metrics may take a while.