Open Access
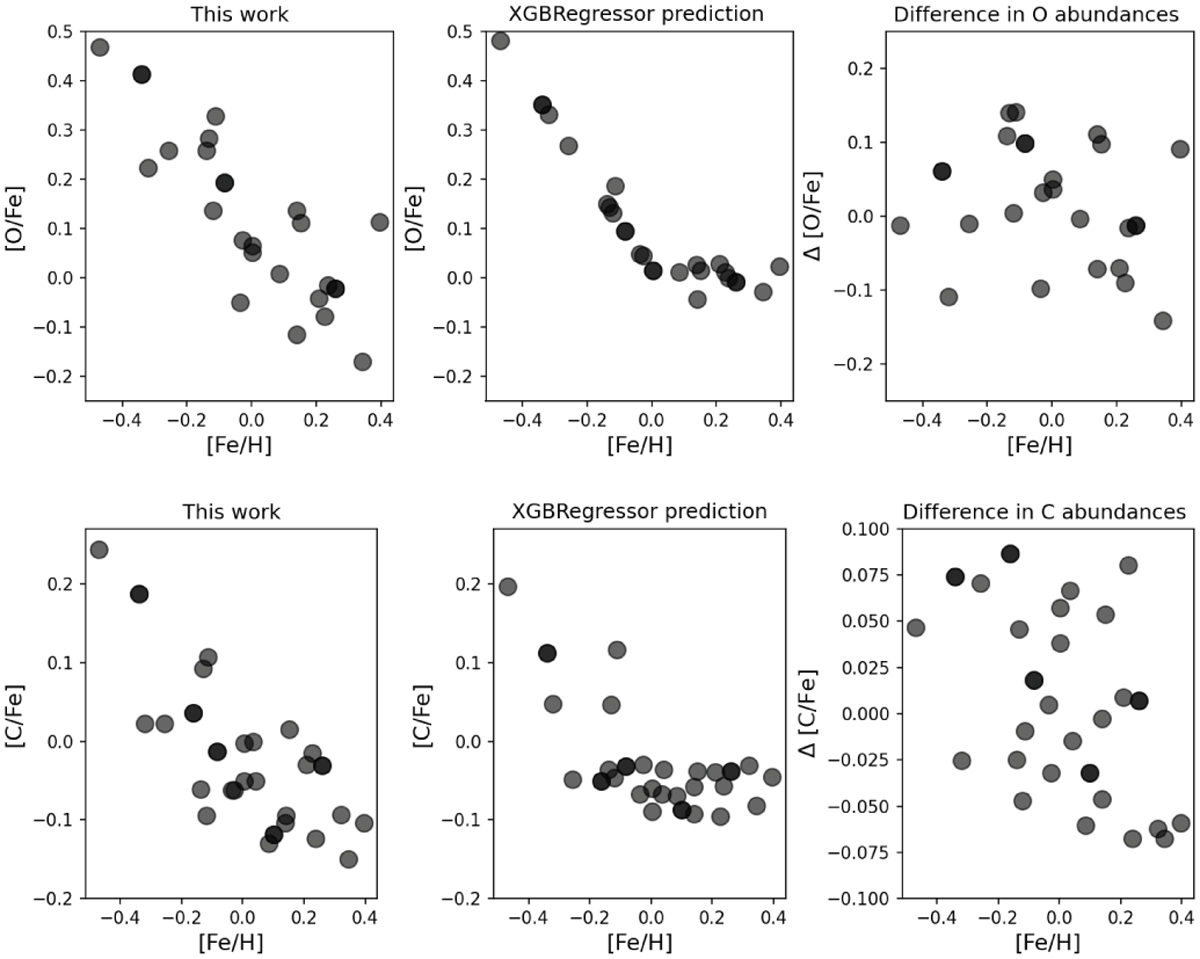
Fig. A.1
Download original image
C and O abundances as a function of metallicity of the sample stars that we spectroscopically determined (leftmost panels), predicted using the model (middle panels), and the difference in the two estimates (rightmost panels).
Current usage metrics show cumulative count of Article Views (full-text article views including HTML views, PDF and ePub downloads, according to the available data) and Abstracts Views on Vision4Press platform.
Data correspond to usage on the plateform after 2015. The current usage metrics is available 48-96 hours after online publication and is updated daily on week days.
Initial download of the metrics may take a while.