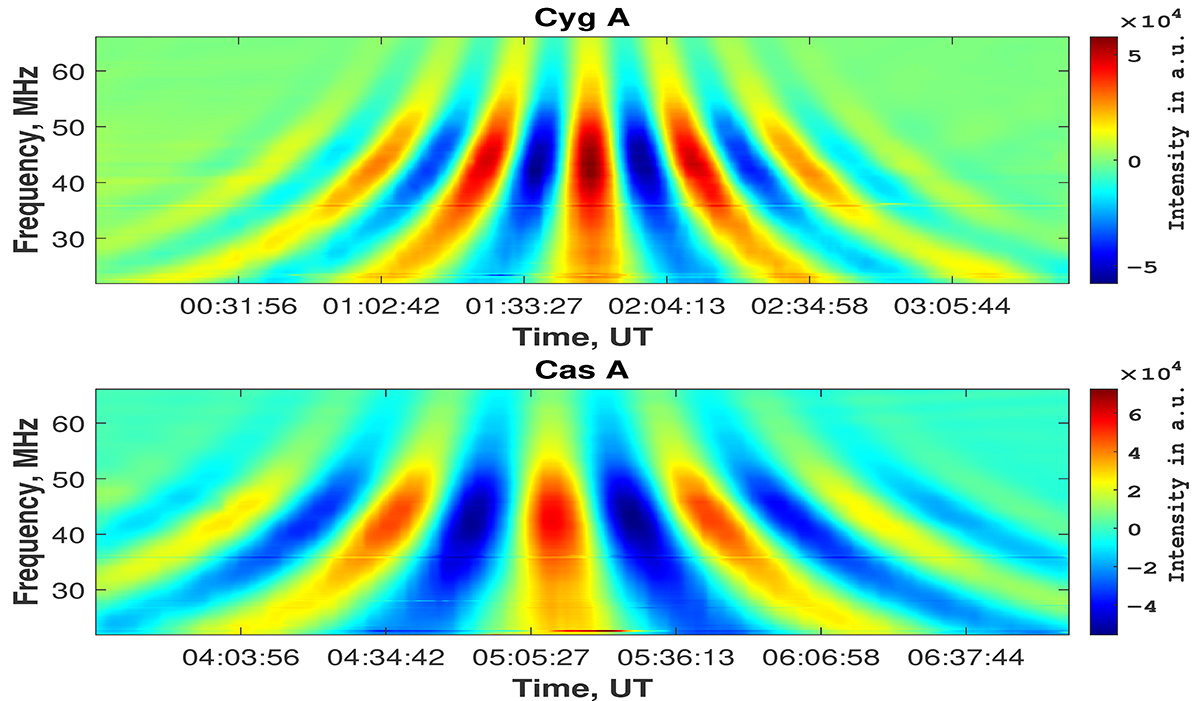
Fig. 3.
Download original image
Interferometric responses obtained from the observations on June 24, 2023 with two mini-arrays of NenuFAR. The color-coded intensity decline of this figure towards lower frequencies is explained by the amplitude-frequency response of this antenna system that includes preamplifiers, filters and others. But this does not affect the spectral results, since we use a ratio of measurements for Cas A and Cyg A.
Current usage metrics show cumulative count of Article Views (full-text article views including HTML views, PDF and ePub downloads, according to the available data) and Abstracts Views on Vision4Press platform.
Data correspond to usage on the plateform after 2015. The current usage metrics is available 48-96 hours after online publication and is updated daily on week days.
Initial download of the metrics may take a while.