| Issue |
A&A
Volume 670, February 2023
|
|
|---|---|---|
| Article Number | A157 | |
| Number of page(s) | 9 | |
| Section | Astrophysical processes | |
| DOI | https://doi.org/10.1051/0004-6361/202245271 | |
| Published online | 24 February 2023 | |
Free–free absorption parameters of Cassiopeia A from low-frequency interferometric observations
1
Institute of Radio Astronomy, National Academy of Sciences of Ukraine, Mystetstv St., 4, 61002 Kharkiv, Ukraine
e-mail: This email address is being protected from spambots. You need JavaScript enabled to view it.
2
V.N. Karazin Kharkiv National University, Svobody Sq., 4, 61022 Kharkiv, Ukraine
Received:
23
October
2022
Accepted:
2
December
2022
Abstract
Context. Cassiopeia A is one of the most extensively studied supernova remnants (SNRs) in our Galaxy. The analysis of its continuum spectrum through low-frequency observations plays an important role for understanding the evolution of the radio source and the propagation of synchrotron emission to observers through the SNR environment and the ionized interstellar medium.
Aims. In this paper we present measurements of the integrated spectrum of Cas A to characterize the properties of free–free absorption toward this SNR. We also add new measurements to track its slowly evolving and decreasing integrated flux density.
Methods. We used the Giant Ukrainian Radio Telescope (GURT) to measure the continuum spectrum of Cassiopeia A within the frequency range of 16–72 MHz. The radio flux density of Cassiopeia A relative to the reference source of the radio galaxy Cygnus A was measured in May–October 2019 with two subarrays of the GURT, used as a two-element correlation interferometer.
Results. We determine magnitudes of emission measure, electron temperature, and an average number of charges of the ions for both internal and external absorbing ionized gas toward Cassiopeia A. Generally, their values are comparable, albeit with slight differences, to recently presented values. In the absence of clumping, we find that the unshocked ejecta of M = 2.61 M⊙ at the electron density of 15.3 cm−3 has a gas temperature of T ≈ 100 K. If the clumping factor is 0.67, then the unshocked ejecta of 0.96 M⊙ has an electron density of 18.7 cm−3.
Conclusions. The integrated flux density spectrum of Cassiopeia A obtained with the GURT interferometric observations is consistent with the theoretical model within measurement errors and also reasonably consistent with other recent results in the literature.
Key words: ISM: individual objects: Cassiopeia A / galaxies: individual: Cygnus A / methods: observational / instrumentation: miscellaneous / telescopes
© L. A. Stanislavsky et al. 2023
 Open Access article, published by EDP Sciences, under the terms of the Creative Commons Attribution License (https://creativecommons.org/licenses/by/4.0), which permits unrestricted use, distribution, and reproduction in any medium, provided the original work is properly cited.
This article is published in open access under the Subscribe-to-Open model. This email address is being protected from spambots. You need JavaScript enabled to view it. to support open access publication.
1. Introduction
Cassiopeia A (Cas A) is a very bright historical supernova remnant (SNR) in our Galaxy whose radio emission has been studied for over 75 years (Ryle & Smith 1948). This remnant has been under scrutiny as no other remnant has. One of the reasons is that Cas A (3C461) is one of the brightest radio sources outside our Solar System. Its radiation is often used as a calibration signal to test the response of radio astronomy instruments (Baars et al. 1977). On the other hand, the young core-collapse remnant has a secular decrease in the flux density (age related, due to adiabatic expansion) historically first predicted by Shklovskii (1960) and thereafter detected at 81 MHz (Högbom & Shakeshaft 1961). The physical essence of these objects is that shell-type SNRs arise from massive stars that explode. The explosion generates a blast wave that interacts first with the circumstellar medium (CSM) and eventually with the interstellar medium (ISM), generating particle accelerating shocks. At the shock front, charged particles are accelerated in a wide range of energies and emit radio waves, X-rays, and even γ-rays (Vink & Laming 2003). Following the nonthermal (synchrotron) nature, the radio source is brighter at long wavelengths, but its maximum intensity falls at frequencies below 25 MHz due to thermal absorption (Dubner & Giacani 2015). Low-frequency radio observations give unique information on the evolution of SNRs and their interaction with the ionized ISM along the line of sight that are sensitive to absorption processes (Kassim et al. 1995; de Gasperin et al. 2020). Moreover, Cas A is one of the few SNRs to exhibit unshocked ejecta through observations (Raymond et al. 2018). Although the ejecta are neutral and very cold early on, they are photoionized and heated by UV and X-ray emission from the ejecta and through reverse and forward shocks. The radio spectrum of Cas A is significantly modified by internal absorption from the unshocked ejecta. Studying the morphology and spectrum of Cas A at low frequencies, the mass and density in the unshocked ejecta were estimated by Arias et al. (2018, and references therein). The external absorption in the ISM also has a noticeable effect on the radio spectrum of Cas A. Therefore, both types of absorption processes should be taken into account for comparison of experimental radio spectra of the SNR with theoretical models at low frequencies. The combination of two electron populations and a time-varying mass in the unshocked ejecta could be responsible for variations superimposed on a smooth secular decline in the flux density of Cas A (Helmboldt & Kassim 2009; Arias et al. 2018). Unfortunately, this phenomenon remains puzzling, although it has been studied for a long time and continues today (Patnaude et al. 2011; Vinyaikin 2014; Trotter et al. 2017).
It is important to note that at very low frequencies (< 100 MHz), there is much less available data on the evolution of the Cas A spectrum than at high frequencies. In the low-frequency range, relative methods for measuring the flux density of radio emission are often used, and as a reference radio source in this case, the radio galaxy Cygnus A (Cyg A) is used (Vinyaikin 2007; Bubnov et al. 2014). Its flux density spectrum is almost unchanged over time. Moreover, in the low-frequency range the radio source (3C405) is closest in magnitude to the source Cas A.
This paper is organized as follows. Starting with important features of our instrumental support, we describe radio observations carried out during May–October 2019. Our measurements of the Cas A flux density are being made relative to Cyg A used as a reference source. This allows us to compare the experimental spectrum of Cas A at 16–72 MHz with its model accounting for the free–free absorption effects in the ISM and the unshocked ejecta within the SNR. Knowing the flux-density spectrum of Cas A in 2019, we find its spectral index, measure parameters of absorbing regions, and estimate the secular decline of the radio flux emitted by Cas A. Finally, we discuss possible reasons for these effects, and summarize our findings.
2. Observations and facilities
2.1. GURT configured as a two-element interferometer
The geographical location (49.6°N) of the Giant Ukrainian Radio Telescope (GURT) allows observations of Cas A and Cyg A sources at almost the same zenith angle ≈9° at the time of their upper culminations (Fig. 1). The instrument is located near Kharkiv (Ukraine). The GURT was designed to receive radio emission within the frequency range of 8–80 MHz (Konovalenko et al. 2016). The observations were carried out with two subarrays each of which consists of 5 × 5 active cross-dipoles. The distance between their phase centers is about 60 m. The two-element correlation interferometer has a non-coplanar baseline (Fig. 2).
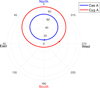 |
Fig. 1. Paths of Cas A and Cyg A on the sky as observed from the GURT over 24 h. The marker on both paths shows a position of each source at 00:01:00 UT on August 8, 2019. This plot displays the position in zenith angle (90°− altitude) and azimuth. |
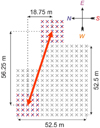 |
Fig. 2. Location of GURT subarrays used in the experiments. The two-element interferometer baseline is noncoplanar. The GURT array consists of 225 active cross-dipoles shown by crosses. |
The effective area of the radio telescope section (5 × 5 elements) in the direction of zenith (with a deviation of up to ∼10°), when the distance between the elements ≤λ/2, takes the form
 (1)
(1)
where d is the distance between elements, n the number of elements in a row, λ the wavelength. At 40 MHz the value is equal to ≈350 m2. The power pattern of the subarray reads
 (2)
(2)
where u and v are direction cosines (u = cos Δ sin Az, v = cos Δcos Az, Δ is the elevation angle, Az is the azimuth), ui and vi are the direction cosines corresponding to the beam direction on the object under study. It follows from Eq. (2) that at 40 MHz, the power pattern width of the subarray is about 20.4°. The experimental value of the power pattern width can be found from the interferometric response of radio sources Cyg A and Cas A. Times of passage of the power pattern at the level of half power are ΔtCyg A = 110 ± 2 min and ΔtCas A = 162 ± 2 min. The pattern width in degree is found from the following expression

where Δt is taken in minutes, and the source declinations are δCyg A ≈ 40.7339° and δCas A ≈ 58.5483°. Consequently, we have ΘCyg A ≈ 20.9° ±1° and ΘCas A ≈ 21.2° ±1°, which are in good agreement with the theoretical calculations. We note that the beamwidth of our interferometer is about three times smaller. Therefore, our flux density measurements are much less contaminated by the extended Galactic background emission.
Relative sensitivity of radio-source measurements is defined as
where Sν, 0 is the flux density of a source under observations, k is the Boltzmann constant, Δν = 4kHz and Δτ = 25 s are the frequency and the time resolutions, and T denotes the brightness temperature of the Galactic background. At 40 MHz the flux density of Cas A is about 27 000 Jy (1 Jy = 10−26 W m−2 Hz−1), whereas the brightness temperature of the Galactic background in this direction of sky equals 15000 K. From here it follows that ΔSν,min/Sν,0 ≈ 1.4 × 10⁻². For the interferometer, this value is  times smaller, that is ≈10−2. Thus, despite the relatively small effective area of the GURT subarray, several powerful cosmic radio sources can be observed with sufficiently high sensitivity. This produces highly reliable data of good quality. For this purpose Cas A is an appropriate radio source.
2.2. Observations
Our observations lasted from May 17 to October 11, 2019. They included records of radio emission with Cas A and Cyg A separately. To provide the flux-density measurement of Cas A, we used Cyg A as a reference source with the well-known flux density which can be considered practically unchanged in comparison with Cas A. The ratio of radiation flux densities of the Cas A to Cyg A sources is related to the ratio of the measured signal powers in the direction of these sources as
 (3)
(3)
Here K is the correction factor that depends on the angular dimensions of the sources, the absorption of radio radiation in the ionosphere due to differences in the angles of the location of the sources, differences in the brightness temperature of the Galactic background near Cas A and Cyg A, flickering of the sources on the inhomogeneities of the ionosphere, and the dependence of the antenna gain on different reception directions. The use of interferometers with a small base makes it possible not to take into account the difference in the angular sizes of the sources if they are significantly smaller than the pattern of the interferometer. However, the base cannot be too small as this widens the interferometer beam, which can capture the Galactic background around the sources differently. Our choice of base length was determined by the GURT array configuration. However, the contamination of accurate flux density measurements by the Galactic background emission is much less than by other factors affecting the value of K. This is supported by the fact that if we consider the positions of the beam of our interferometer at the locations of Cas A and Cyg A on the accurate all-sky map of Dowell et al. (2017) at 35 MHz, then it is clear that for both radio sources this beam captures, on average, approximately the same intensity region of the Galactic plane. At higher frequencies the situation is even better. We also recall the favorable geographic location of the GURT, which allows the sources of Cas A and Cyg A to be observed at almost the same zenith angle of ≈9° at the time of their upper culminations. Thus, the parameters of the phased antenna array in the directions toward the sources may become almost identical. The significant factor that prevents the adjustment of the correction factor K to a value of one is the ionospheric flickering. To reduce the influence of the ionosphere on the ratio of source fluxes, our observations were made in quiet conditions, and in further processing only the sessions obtained in conditions of a relatively undisturbed state of ionosphere were used. In addition, the results were averaged over a number of sessions. The number of favorable sessions was 58. Eventually the mean error of our measurements is about 10–15%.
Cygnus A is the most powerful extragalactic source of radio emission (∼1038 W) in its constellation (as evidenced by the letter A in the name) and one of the brightest in the entire sky. It was discovered by Grote Reber in 1939. It is found at a distance from us of 600 million light years, and has a redshift of z = 0.057. The significant difference in the radio emission power of Cyg A and the closest external star system to us such as the Andromeda galaxy (∼1032 W) subsequently led to the division of galaxies into two types, one of which includes normal galaxies similar to the Andromeda Nebula, whereas the other consists of radio galaxies. In the meter and decameter wavelength ranges, the flux density of Cyg A, expressed in Jy, is described by the relation
![Mathematical equation: $$ \begin{aligned} S_{\nu ,\ \mathrm Cyg\ A}&= 3.835\times 10^5\left(\frac{\nu }{\mathrm{MHz}}\right)^{-0.718}\nonumber \\&\times \exp \left[-0.342\left(21.713/\left(\frac{\nu }{\mathrm{MHz}}\right)\right)^{2.1}\right], \end{aligned} $$](/articles/aa/full_html/2023/02/aa45271-22/aa45271-22-eq7.gif) (4)
(4)
where ν is the observation frequency in MHz (Kassim & Perley 1996; Vinyaikin 2006; Men’ 2008). The exponential term of Sν,Cyg A was introduced to account for line-of-sight Galactic thermal absorption independent of the power-law synchrotron emission intrinsic to the source. Galactic thermal absorption is expected since Cyg A lies in the Galactic plane. Using the calculated values of the flux density of Cyg A, obtained from Eq. (4) together with the experimental data for the ratios of radio fluxes from Cas A and Cyg A, the flux density of Cas A on a selected frequency grid was found (see Fig. 3 and next comments below). To obtain the most reliable results, the values of the source flux-density ratios at different frequencies were averaged by frequency to a selected frequency grid and by days.
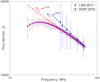 |
Fig. 3. Radio spectrum of Cas A in the range 16–72 MHz. The red and blue dashed lines indicate spectral indexes of the measured radiation at 38–70 MHz for Cas A obtained with the GURT and the LWA (Dowell et al. 2017) radio telescopes, respectively. |
It should be pointed out that both Cas A and Cyg A lie in the Galactic plane, and therefore are both subject to low-frequency turnovers in their spectrum from extrinsic thermal absorption (not just Cas A). However, the absorption toward each is different because they are located in different regions along the Galactic plane. Fortunately, since the absorbed spectrum of Cyg A was previously characterized in the GURT frequency range, we can still use it to calibrate our measurements of Cas A.
3. Data analysis
3.1. Spectral measurements
Radio records were implemented with one of advanced digital receivers (ADRs), which serve as standard backends for the GURT observations (Zakharenko et al. 2016). Its time resolution was about 1 s in the frequency resolution of 19.073 kHz. The ADR has two entries to measure cross-spectra (see examples in Appendix ). In the observations of Cas A and Cyg A one entry of the ADR was connected to one GURT subarray, and the second entry to another subarray. The measurements of the ratio of flux densities of Cas A to Cyg A were made from 12 MHz to 73 MHz in 1 MHz steps. Unfortunately, at < 15 MHz the GURT records of the radio sources were contaminated by intensive radio frequency interference (RFI). Therefore, our data analysis covers mainly the frequency range 16–72 MHz.
3.2. Filtration of direction-dependent effects
The ratio of measured flux densities of Cas A to Cyg A contains a quasi-periodic ripple. It is caused by systematic oscillations in the beam properties as a function of frequency (Popping & Braun 2008). There can be a number of reasons for this. The GURT array is located above a non-ideal reflecting ground. Moreover, the beam pattern may show variability or distortions due to mutual coupling between array elements, which are direction dependent. We also note that the interferometric baseline in our experiment is non-coplanar. The ionosphere can also introduce direction dependent effects, although they are minimized on the relatively short baselines used in our observations (Erickson 1984). To mitigate these complications, many different methods have been developed (Bhatnagar et al. 2013; Smirnov 2011). They are quite time-consuming and aimed at obtaining high-quality resolved radio images from interferometric measurements. The methodology of our experiment, since our sources are extremely bright and unresolved, is simpler, which allows us to use simpler techniques to mitigate these direction-dependent effects. Assuming that the quasi-periodic oscillations in the ratio of flux densities of Cas A to Cyg A are mainly caused by instrumental effects; they were filtered with the help of the empirical mode decomposition (EMD) of Huang et al. (1998). This makes it possible to separate the smooth component from the oscillating ones.
3.3. Models of synchrotron source and free–free absorption
Without loss of generality, we start with the model of a homogeneous cylindrical synchrotron source (Pacholczyk 1970, see p. 97). Its functional form is written as
 (5)
(5)
where γ characterizes a power-law distribution of electrons (N(E)=N0E−γ), and the dimensionless variable z = ν/ν1 is the normalized frequency. The flux density of the radio source Sν = AJγ(ν/ν1) depends on three parameters: γ, ν1, and A. They describe the synchrotron emission from the SNR, the structure and features of which are approximately known. The values of ν1 and A are both dependent on the magnetic field strength B. Following the results of Arias et al. (2018), we adopt B = 0.78 mG. Next, using the experimental measurements of the Cas A flux density at the frequency of 1 GHz, taken from the above reference, we come to γ = 2.52, ν1 = 6.15 MHz, and A = 140 500 Jy. Thus, the expression gives the unabsorbed synchrotron spectrum of Cas A.
The synchrotron emission propagates to observers through the SNR and the ISM, where it is absorbed by intervening thermal gas. The absorption consists of two components. The internal one occurs inside the SNR, more specifically in its unshocked ejecta usually difficult to study. The external component is caused by the local ISM located around the SNR, where the remnant shock front has not yet reached. Following Kassim et al. (1995) and DeLaney et al. (2014), there is internal free–free absorption in Cas A due to the unshocked ejecta . The medium causing internal absorption is interior to the bright radio shell, so it does not absorb radio emission generated in the front part of the shell. For external absorption this effect does not take place. Hence, the flux density can be modeled as
 (6)
(6)
where τν,int and τν,ISM are the free–free optical depth for the unshocked ejecta and the ISM, respectively (Arias et al. 2018). As Cas A is quite clumpy, the relative synchrotron brightness contributed from the front and back halves of the remnant, as viewed from Earth, differ. Taking Sν,front = faSν and Sν,back = (1−fa)Sν, we consider the absorption on the two halves of the shell. The free–free optical depth is determined in the Rayleigh–Jeans approximation (Wilson et al. 2009, see pp. 250–252). Then the value reads
 (7)
(7)
where EM is the emission measure, Z is the average number of ion charges, T is the electron temperature of the absorbing medium, and gff denotes the Gaunt factor given by
![Mathematical equation: $$ \begin{aligned} g_{\rm ff}=\left\{ \begin{array}{ll} \ln \left[49.55\,Z^{-1}\left(\frac{\nu }{\mathrm{MHz}}\right)^{-1}\right]+1.5\ln \frac{T}{\mathrm{K}}&\\ 1 \qquad \text{ for}\qquad \frac{\nu }{\mathrm{MHz}}\gg \left(\frac{T}{\mathrm{K}}\right)^{3/2}.&\end{array}\right. \end{aligned} $$](/articles/aa/full_html/2023/02/aa45271-22/aa45271-22-eq11.gif) (8)
(8)
The emission measure is defined along the line of sight as
 (9)
(9)
in terms of electron density ne and ion density ni. Due to the free–free absorption, the integrated spectrum of Cas A peaks in the GURT observing band, as indicated by our radio measurements (see Figs. 3 and 4). In the epoch of 2019 the spectrum peaks at 22 ± 0.5 MHz, and its value is 31 743 ± 1894 Jy.
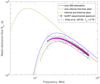 |
Fig. 4. Effect of different forms of thermal absorption on the radio spectrum of Cas A as well as the fitting of the theoretical dependence to our experimental data obtained with the help of the GURT two-array interferometer (fa ≈ 0.86). The observations cover the frequency range 16–72 MHz. The black dotted line below our measured spectrum shows the integrated spectrum of Cas A with the parameter values from Arias et al. (2018), where fa = 0.78 is taken. |
3.4. Measurements of free–free absorption parameters for Cas A
From Arias et al. (2018) the ISM absorption along the line of sight to Cas A has EM = 0.13 pc cm−6 for a 20 K ISM with Z = 1, whereas the internal absorption is characterized by a temperature of T = 100 K and an average ionization state of Z = 3 with an average emission measure of EM = 37.4 pc cm−6. In this case the value fa = 0.78 of the radio emission emerging from the projected area of the reverse shock comes from the foreground side of the shell. Consequently, we can draw the flux density spectrum of Cas A in the presence and absence of absorption. We note that the measurement of EM values due to ISM absorption gave only an upper limit on the average electron density along the line of sight. On the other hand, the internal free–free absorption was measured from emission measure maps having extreme values. Pixel blanking up to 40% was employed to exclude extreme values; nonetheless, the derived EM = 37.4 pc cm−6 may reflect a residual systematic error. The symbol Z is the average atomic number of the ions dominating the absorbing regions. In particular, the value of Zint = 2–3 in the unshocked ejecta of Cas A is more reasonable as it is the average number of ionizations. Following Arias et al. (2018), there is some reason to believe that the temperature of the ISM and inside the unshocked ejecta of Cas A is 20 K and 100 K, respectively. However, they are based on assumptions, although the T = 100 K assumption is supported by Raymond et al. (2018). Overall, given the uncertainties, independent measurements of the parameter values for the internal and external absorption in Cas A as presented in Arias et al. (2018) are useful.
Assuming values of EM, T, Z, and fa from Arias et al. (2018), there is a noticeable discrepancy between predictions of Eq. (6) and the flux-density spectrum of Cas A obtained in our observations. To illustrate this discrepency, we derived the specified values based on our experimental data. We note that the optical depth τν is linear with respect to the emission measure EM, whereas T and Z give a nonlinear contribution. To fit our experimental spectrum to the theoretical curve Sν under absorption, we need to set up seven parameters. For this purpose we used the nonlinear curve fitting in the least-squares sense. The parameter values found are presented in Table 1; EMint, Tint, and TISM agree closely with the values in Arias et al. (2018), but the value of EMISM is ∼27% higher, and fa is ∼10% higher (i.e., fa = 0.86 instead of 0.78). This difference is probably due to the fact that we cannot resolve the unshocked ejecta against the source as we do not make exactly the same measurement. Our value of fa implies that in the absorbing region most of the radio emission is dominated by the front side of the shell. Arias et al. (2018) also find that most of the emission is dominated from the front side of the shell. So we are in agreement. The average atomic numbers of the ions in the internal and external absorption regions are Zint ≈ 2.55 and ZISM ≈ 0.51. The errors listed in Table 1 were derived from errors in the measured spectrum. The comparison between theoretical and experimental results is shown in Fig. 4. Using the fitted spectrum, we find its maximum 32 191 Jy at 22.345 MHz.
Parameters of absorbing regions in Cas A obtained from the integrated continuum flux-density spectrum measured with the GURT interferometer.
4. Secular decline of the radio flux of Cas A
The most important characteristic of radiation from any radio source is its spectrum. In radio astronomy, the spectral flux density from nonthermal sources is usually defined as Sν = C ν−α, where ν is the frequency of radio emission, C is a constant value, and α denotes the spectral index. In a very wide range of frequencies the same value of the parameter α rarely manages to represent the change in Sν (i.e., the spectra show curvature). For example, in many metagalactic radio sources, the spectral index in the decimeter and centimeter ranges is greater than in the meter range. Sometimes such radio sources have a smooth increase in α with increasing frequency. In 2013 the measurements of the Cas A spectral index gave the value of 0.81 at 38–70 MHz (Dowell et al. 2017). Our results in 2019 lead to α = 0.59 ± 0.02 in the same frequency range (see Fig. 3). This difference in the values of the spectral index from 2013 to 2019 reflects a time- and frequency-varying secular decline that has been recognized for some time in Cas A. This secular decline is also detected in the ratio of flux densities of Cas A to Cyg A at 38 MHz shown in Fig. 5 for many years of observations. As can be seen, the radio data we obtained are consistent with the expected decrease in the flux density of Cas A. The declining Cas A flux density is a natural consequence of adiabatic cooling, originating from the SNR expansion. Considering the still enormous magnitude of the radio flux of Cas A, sensitive observations, even separated from each other by small time intervals, reveal not only the age-related decrease in the flux, but also a change in the spectrum.
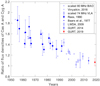 |
Fig. 5. Results of many different measurements for the ratio of flux densities of Cas A to Cyg A at 38 MHz in time (from 1954 to 2019) that were published in literature (Baars et al. 1977; Rees 1990; Vinyaikin 2006; Helmboldt & Kassim 2009). Also included are scaled versions of the 80 MHz data of Martirossyan et al. (2002, BAO) as well as the GURT observations obtained in 2014 (Bubnov et al. 2014) and 2019. |
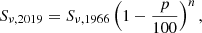
The rate of decrease in the flux density of Cas A for the period 1966–2019 was calculated by using the expression
 (10)
(10)
where Sν, 2019 and Sν, 1966 are the flux densities in 2019 and 1966, respectively. Here p is the annual decrease in flux density in percent, and n denotes the observation period in years. The results of calculations according to Eq. (10) are summarized in Table 2. The flux-density values of Cas A in the 1966 epoch at frequencies of 14.7 MHz, 16.7 MHz, 20 MHz, and 25 MHz were obtained by Braude et al. (1969) using the Ukrainian T-shape Radiotelescope, first modification (UTR-1). The flux-density data at 38 MHz in the 1966 epoch were taken from Baars et al. (1977). Based on Table 2, it should be noted that the decrease in the Cas A flux density from 1966 to 2019 per year in the 15–38 MHz frequency band is 1.26 ± 0.35% per year on average. At the frequency of 38 MHz, this decrease tends to 0.55 ± 0.14%.
Rate of decrease in the flux density for the radio emission of Cas A in dependence on frequency from our observations of 2019 and according to the data of Braude et al. (1969) and Baars et al. (1977).
5. Discussion
5.1. Internal electron density and mass
The measured magnitudes of emission measure EM, temperature T, and average number of charges of the ions Z for internal free–free absorption allow us to estimate the electron density and the mass of the unshocked ejecta. However, the estimates are sensitive to the ejecta geometry, which is not exactly known, and its description requires assumptions. If the electron density in the unshocked ejecta is constant, and ne = ni, then Eq. (9) simplifies to  , where l is the combined thickness of the unshocked ejecta sheets. The clumping of the unshocked ejecta can reduce the total volume of the medium, increasing its density. By the clumping factor 0 < Cf ≤ 1 the effect is taken into account. Then the electron density in the unshocked ejecta is written as
  . If Cf = 1, there is no clumping; Cf < 1 indicates a degree of clumping. As DeLaney et al. (2014), we take these sheets to be 0.16 pc thick. For Cf = 1 the internal electron density is about 15.3 cm−3. If Cf = 0.67, the value of ne increases to 18.7 cm−3.
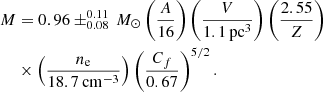
The total mass of unshocked ejecta has the simple form M = Vρ (i.e., the product of its volume V and its density ρ). Following DeLaney et al. (2014), the total volume of internal absorbing material is V = πR2l = 1.1 pc3. If the effect of clumping is present, we simply modify R and l by the clumping factor Cf (as Cfl and CfR). As the main contributors to the mass are the ions, then their density is  , where A is an average mass number and mp is the mass of the proton. Thus, the total mass of the unshocked ejecta yields
 (11)
(11)
Therefore, our estimate of the mass in the unshocked ejecta with the clumping effect gives about 0.96 ± 0.11 M⊙, whereas without clumping the mass reaches 2.61 ± 0.31 M⊙, which is close to the value of 2.95 ± 0.48 M⊙ obtained by Arias et al. (2018). Taking into account the clumping contribution, our value agrees with the independent estimate of  from Laming & Temim (2020). Recently, a similar estimate of 0.6–0.8 M⊙ has been found by Priestley et al. (2022).
Considering the unshocked ejecta without clumping, the ejecta mass can be overestimated. If the progenitor mass before the explosion is 4–6 M⊙ (Young et al. 2006), the mass in the unshocked ejecta is quite high. There are two ways to solve this puzzle. One of them is to assume that the unshocked ejecta is clumped. Then the mass estimate becomes significantly smaller and more appropriate. On the other hand, the progenitor of Cas A is thought to have 15–25 M⊙ as a star that lost its hydrogen envelope to a binary interaction (Chevalier & Oishi 2003). In this case the mass estimate in the unshocked ejecta without clumping effects would be acceptable. Unfortunately, the progenitor mass of Cas A is not yet definitely known. Therefore, often both scenarios are considered.
5.2. Turnover in the low-frequency spectrum of Cas A
The integrated radio spectrum of Cas A has been studied for a long time (Kassim 1989; Kellermann 2009). One of its remarkable features is an extreme at low frequencies. Following Table 2 of Baars et al. (1977), in the epoch of 1966 the spectral turnover is located below 38 MHz, between 14.7 MHz and 20 MHz (Braude et al. 1969). The fitting of the flux-density spectrum gives 18 MHz as a spectral maximum (Vinyaikin 2007). However, direct measurements of this turnover frequency are rather complicated. If the frequencies of the extrema in the spectral flux density of radio sources are in the centimeter, decimeter, or short-wave part of the meter wavelength range, then these measurements are usually fairly easy. Observations at the lower frequencies, especially below 20 MHz, are very difficult since they are significantly susceptible to the RFI and are influenced by the cosmic medium and solar supercorona. Moreover, the contribution of the Earth’s ionosphere often makes the regular ground-based measurements at frequencies below 20 MHz unsuccessful and unreliable. Not surprisingly, there are different estimates of the frequency, where the spectral maximum of Cas A is located (Vinyaikin et al. 1987; Kassim et al. 1995; Vinyaikin 2014). Recently, the dominant opinion is that the turnover in the integrated spectrum of Cas A is at 20 MHz (Arias et al. 2018). From our observations of 2019 the frequency is 22 ± 0.5 MHz. Due to small errors in the measurements, the fitting of the measured flux-density spectrum estimates the value of 22.345 MHz. This may indicate that the spectral maximum of Cas A is not fixed in time and frequency, and from 1966 to 2019 it changed its position by 4 MHz toward higher frequencies. In addition, the peak decreases in intensity. For half a century, the highest value in the spectrum of Cas A has decreased in magnitude by about half. The most significant reason for this evolution is most likely a decrease in the intensity of synchrotron radiation from the source as it expands and cools.
This forces us to look at the free–free absorption by the ISM ionized gas along the line of sight to the source differently. Direct and reverse shock waves of the SNR can rake up the absorbing material inside the space between them. This addition to the ISM gives an increase in the emission measure of external absorption. Consequently, the optical depth increases, and the spectral maximum of Cas A shifts toward higher frequencies. If we assume that the frequency shift of 4 MHz occurs only due to the emission measure of external absorption, then the value of the latter would increase from ∼0.11 to ∼0.17 pc cm−6. In this regard, it should be emphasized that further low-frequency measurements of the integrated spectrum of Cas A would be helpful for a more detailed understanding of how the internal and external absorption changes with time.
6. Conclusions
We measured the integrated radio continuum spectrum of Cas A at 16–72 MHz in the epoch of 2019. Using a two-element correlation interferometer based on the GURT array, the radio galaxy Cyg A was used as a reference radio source whose known spectrum was assumed to be constant. Fitting the spectral model of Cas A with free–free absorption effects from the ISM and interior unshocked ejecta, the parameter values (EM, T, Z, and fa) of internal and external absorption were found. Comparing our measurements with published results for the flux density of Cas A in a wide frequency band, the secular decline was detected and matches the expected. We summarize our results as follows:
-
The measured spectrum of Cas A with the GURT interferometric observations is consistent with the theoretical spectrum within the measurement errors. The spectrum of Cas A is determined not only by the synchrotron emission mechanism, but also by thermal absorption inside the SNR and in the ISM.
-
In the epoch of 2019 the peak of the Cas A flux-density spectrum is 31743 ± 1894 Jy at 22 ± 0.5 MHz.
-
From our measurements, the area associated with unshocked ionized ejecta internal to the reverse shock has a temperature T ≈ 100 K, an average ionisation state of Z ≈ 2.55, and an average emission measure of EM ≈ 37.36 pc cm−6.
-
We measure the ISM absorption along the line of sight to Cas A to be EM ≈ 0.17 pc cm−6 for a 20 K ISM. Arias et al. (2018) determined that 78% of the emission emerging from the region projected against the unshocked ejecta came from the foreground side of Cas A. Our slightly higher value of 86% is not unexpected since we do not have the angular resolution to isolate the region of emission against the region of unshocked ejecta.
-
The measured free–free absorption parameters, mentioned by Arias et al. (2018), are close enough to our experimental estimates for their values, although some of them are clarified.
-
Our estimate of the internal electron density in the unshocked ejecta is about 15.3 cm−3, whereas the ejecta mass is 2.61 ± 0.31 M⊙. This unshocked ejecta is not clumped. If the clumping factor is 0.67, for example, then the electron density is 18.7 cm−3, and the mass decreases to 0.96 ± 0.11 M⊙.
-
In the frequency range of < 70 MHz, the flux density of Cas A decreases faster at lower frequencies than at higher frequencies. This is due to the fact that the spectral index decreases in time. If in the epoch of 2013 its value is about 0.81 in the frequency range of 38–70 MHz, then in 2019 the spectral index fell to 0.59 ± 0.02 (i.e., the radio spectrum of Cas A is flattening). The observed effect is most likely primarily due to a flattening of the radio synchrotron spectrum of Cas A itself (Vinyaikin 2014).
-
At the frequency of 38 MHz, the decrease in the Cas A flux density from 1966 to 2019 was 0.55 ± 0.14% per year.
-
It should be noted that most of the values of the free–free absorption parameters toward Cas A are consistent with other recently published results in the literature (Arias et al. 2018, and references therein). However, we also found differences, such as a 4 MHz shift for the spectral maximum of Cas A toward higher frequencies from 1966 to 2019. Our results are important because they confirm previous results in a completely independent way with a completely different instrument. Our instrument is one of the few in the world capable of operating at such low frequencies, and this independent confirmation is very important.
Further radio observations in the 16–72 MHz range could determine the evolution of the free–free absorption parameters of Cas A. Although these changes are expected to be rather slow, the sensitivity and accuracy of modern low-frequency interferometers have now reached a high level, allowing one to detect a decrease in the radio flux density from Cas A for a shorter observation time. Thus, these measurements would be useful for a better understanding of the absorption processes inside and outside the SNR.
Acknowledgments
The authors acknowledge the partial support of the National Academy of Sciences of Ukraine under Contracts No. 0122U002459, 0122U002460 and 0122U002537. Personally, we are grateful to M. Arias and O. Ulyanov for their useful remarks and discussions. We also thank the anonymous referee for very valuable comments that contributed to improve the quality of the manuscript.
References
- Arias, M., Vink, J., de Gasperin, F., et al. 2018, A&A, 612, A110 [NASA ADS] [CrossRef] [EDP Sciences] [Google Scholar]
- Baars, J., Genzel, R., Pauliny-Toth, I., & Witzel, A. 1977, A&A, 61, 99 [NASA ADS] [Google Scholar]
- Bhatnagar, S., Rau, U., & Golap, K. 2013, ApJ, 770, 91 [Google Scholar]
- Braude, S. Y., Lebedeva, O. M., Megn, A. V., Ryabov, B. P., & Zhouck, I. N. 1969, MNRAS, 143, 289 [NASA ADS] [Google Scholar]
- Bubnov, I. N., Konovalenko, A. A., Stanislavsky, A. A., et al. 2014, Radio Phys. Radio Astron., 19, 111 [NASA ADS] [CrossRef] [Google Scholar]
- Chevalier, R. A., & Oishi, J. 2003, ApJ, 593, L23 [NASA ADS] [CrossRef] [Google Scholar]
- de Gasperin, F., Vink, J., McKean, J. P., et al. 2020, A&A, 635, A150 [NASA ADS] [CrossRef] [EDP Sciences] [Google Scholar]
- DeLaney, T., Kassim, N., Rudnick, L., & Perley, R. 2014, ApJ, 785, 7 [NASA ADS] [CrossRef] [Google Scholar]
- Dowell, J., Taylor, G. B., Schinzel, F. K., et al. 2017, MNRAS, 469, 4537 [CrossRef] [Google Scholar]
- Dubner, G., & Giacani, E. 2015, A&A Rev., 23, 3 [NASA ADS] [CrossRef] [Google Scholar]
- Erickson, W. C. 1984, J. Astrophys. Astron., 5, 55 [NASA ADS] [CrossRef] [Google Scholar]
- Helmboldt, J. F., & Kassim, N. E. 2009, ApJ, 138, 838 [CrossRef] [Google Scholar]
- Högbom, J. A., & Shakeshaft, J. R. 1961, Nature, 189, 561 [CrossRef] [Google Scholar]
- Huang, N. E., Shen, Z., & Long, S. R. 1998, Proc. Roy. Soc. London, A454, 903 [NASA ADS] [CrossRef] [Google Scholar]
- Kassim, N. 1989, ApJ, 347, 915 [NASA ADS] [CrossRef] [Google Scholar]
- Kassim, N., Perley, R., Dwarakanath, K., & Erickson, W. 1995, ApJ, 445, L59 [NASA ADS] [CrossRef] [Google Scholar]
- Kassim, N., & Perley, R. A. 1996, Proc. Greenbank Workshop, West Virginia, 1–4 May 1995 (Cambridge: Cambridge University Press), 182 [Google Scholar]
- Kellermann, K. I. 2009, A&A, 500, 143 [NASA ADS] [CrossRef] [EDP Sciences] [Google Scholar]
- Konovalenko, A., Sodin, L., Zakharenko, V., et al. 2016, Exp. Astron., 42, 11 [NASA ADS] [CrossRef] [Google Scholar]
- Laming, J. M., & Temim, T. 2020, ApJ, 904, 115 [NASA ADS] [CrossRef] [Google Scholar]
- Martirossyan, R. M., Goulyan, A. G., Sanamyan, V. A., & Manaselyan, Kh. A. 2002, Astrophysics, 45, 365 [NASA ADS] [CrossRef] [Google Scholar]
- Men’, A. V. 2008, Radiophys. Quant. Electron., 51, 83 [CrossRef] [Google Scholar]
- Pacholczyk, A. G. 1970, Radio Astrophysics: Nonthermal Proccesses in Galactic and Extragalactic Sources (San Francisco: W. H. Freeman and Co.) [Google Scholar]
- Patnaude, D. J., Vink, J., Laming, J. M., & Fesen, R. A. 2011, ApJ, 729, L28 [NASA ADS] [CrossRef] [Google Scholar]
- Popping, A., & Braun, R. 2008, A&A, 479, 903 [NASA ADS] [CrossRef] [EDP Sciences] [Google Scholar]
- Priestley, F. D., Arias, M., Barlow, M. J., & De Looze, I. 2022, MNRAS, 509, 3163 [Google Scholar]
- Raymond, J. C., Koo, B.-C., Lee, Y.-H., et al. 2018, ApJ, 866, 128 [NASA ADS] [CrossRef] [Google Scholar]
- Rees, N. 1990, MNRAS, 243, 637 [NASA ADS] [Google Scholar]
- Ryle, M., & Smith, F. G. 1948, Nature, 162, 462 [NASA ADS] [CrossRef] [Google Scholar]
- Shklovskii, I. S. 1960, Sov. Astron., 4, 243 [NASA ADS] [Google Scholar]
- Smirnov, O. M. 2011, A&A, 527, A107 [NASA ADS] [CrossRef] [EDP Sciences] [Google Scholar]
- Trotter, A. S., Reichart, D. E., Egger, R. E., et al. 2017, MNRAS, 469, 1299 [NASA ADS] [CrossRef] [Google Scholar]
- Vink, J., & Laming, J. M. 2003, ApJ, 584, 758 [CrossRef] [Google Scholar]
- Vinyaikin, E. N. 2006, Astron. Rep., 50, 143 [NASA ADS] [CrossRef] [Google Scholar]
- Vinyaikin, E. N. 2007, Astron. Rep., 51, 87 [NASA ADS] [CrossRef] [Google Scholar]
- Vinyaikin, E. N. 2014, Astron. Rep., 58, 626 [NASA ADS] [CrossRef] [Google Scholar]
- Vinyaikin, E. N., Nikonov, V. A., Tarasov, A. F., et al. 1987, Sov. Astron., 31, 517 [NASA ADS] [Google Scholar]
- Wilson, T. L., Rohlfs, K., & Hüttemeister, S. 2009, Tools of Radio Astronomy (Berlin: Springer-Verlag) [Google Scholar]
- Young, P. A., Fryer, C. L., Hungerford, A., et al. 2006, ApJ, 640, 891 [NASA ADS] [CrossRef] [Google Scholar]
- Zakharenko, V., Konovalenko, A., Zarka, P., et al. 2016, J. Astron. Instrum., 5, 1641010 [CrossRef] [Google Scholar]
Appendix A: Interferometric responses of Cyg A and Cas A in the GURT subarrays
In this appendix we present examples of interferometer measurements made by the two subarrays within GURT, as described in Section 2.1.
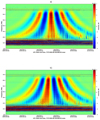 |
Fig. A.1. Dynamic cross-spectra of the interferometric response in the terms of even (a) and odd (b) parts from radio emission of Cyg A observed by two GURT subarrays on August 17, 2019. The radio source passes through the fixed patterns of antennas. |
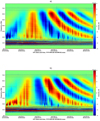 |
Fig. A.2. Dynamic cross-spectra of the interferometric response in the form of even (a) and odd (b) parts from radio emission of Cas A observed by two GURT subarrays on August 17, 2019. The recording of Cas A is limited at the beginning, since the time difference between the culminations of Cyg A and Cas A is about 3.5 hours, and Cyg A is observed earlier than Cas A. Therefore, the switching from one radio source to another occurs approximately in the middle of each observation session. |
All Tables
Parameters of absorbing regions in Cas A obtained from the integrated continuum flux-density spectrum measured with the GURT interferometer.
Rate of decrease in the flux density for the radio emission of Cas A in dependence on frequency from our observations of 2019 and according to the data of Braude et al. (1969) and Baars et al. (1977).
All Figures
|
Fig. 1. Paths of Cas A and Cyg A on the sky as observed from the GURT over 24 h. The marker on both paths shows a position of each source at 00:01:00 UT on August 8, 2019. This plot displays the position in zenith angle (90°− altitude) and azimuth. |
| In the text | |
|
Fig. 2. Location of GURT subarrays used in the experiments. The two-element interferometer baseline is noncoplanar. The GURT array consists of 225 active cross-dipoles shown by crosses. |
| In the text | |
|
Fig. 3. Radio spectrum of Cas A in the range 16–72 MHz. The red and blue dashed lines indicate spectral indexes of the measured radiation at 38–70 MHz for Cas A obtained with the GURT and the LWA (Dowell et al. 2017) radio telescopes, respectively. |
| In the text | |
|
Fig. 4. Effect of different forms of thermal absorption on the radio spectrum of Cas A as well as the fitting of the theoretical dependence to our experimental data obtained with the help of the GURT two-array interferometer (fa ≈ 0.86). The observations cover the frequency range 16–72 MHz. The black dotted line below our measured spectrum shows the integrated spectrum of Cas A with the parameter values from Arias et al. (2018), where fa = 0.78 is taken. |
| In the text | |
|
Fig. 5. Results of many different measurements for the ratio of flux densities of Cas A to Cyg A at 38 MHz in time (from 1954 to 2019) that were published in literature (Baars et al. 1977; Rees 1990; Vinyaikin 2006; Helmboldt & Kassim 2009). Also included are scaled versions of the 80 MHz data of Martirossyan et al. (2002, BAO) as well as the GURT observations obtained in 2014 (Bubnov et al. 2014) and 2019. |
| In the text | |
|
Fig. A.1. Dynamic cross-spectra of the interferometric response in the terms of even (a) and odd (b) parts from radio emission of Cyg A observed by two GURT subarrays on August 17, 2019. The radio source passes through the fixed patterns of antennas. |
| In the text | |
|
Fig. A.2. Dynamic cross-spectra of the interferometric response in the form of even (a) and odd (b) parts from radio emission of Cas A observed by two GURT subarrays on August 17, 2019. The recording of Cas A is limited at the beginning, since the time difference between the culminations of Cyg A and Cas A is about 3.5 hours, and Cyg A is observed earlier than Cas A. Therefore, the switching from one radio source to another occurs approximately in the middle of each observation session. |
| In the text | |
Current usage metrics show cumulative count of Article Views (full-text article views including HTML views, PDF and ePub downloads, according to the available data) and Abstracts Views on Vision4Press platform.
Data correspond to usage on the plateform after 2015. The current usage metrics is available 48-96 hours after online publication and is updated daily on week days.
Initial download of the metrics may take a while.