Fig. 3.
Download original image
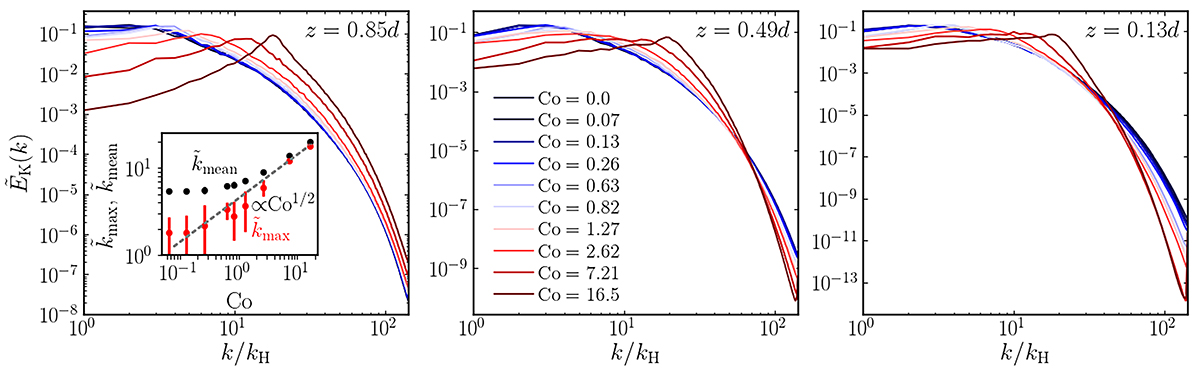
Normalised velocity power spectra ![]() near the surface (left panel), middle (middle), and base (right) of the CZ from runs in Set A with Co varying between 0 and 16.5. The inset in the left panel shows the mean scale
near the surface (left panel), middle (middle), and base (right) of the CZ from runs in Set A with Co varying between 0 and 16.5. The inset in the left panel shows the mean scale ![]() and wavenumber where E(k) has its maximum (
and wavenumber where E(k) has its maximum (![]() ) as functions of Co for z/d = 0.85. The error bars indicate the standard deviation. The grey dashed line shows a power law proportional to Co1/2.
) as functions of Co for z/d = 0.85. The error bars indicate the standard deviation. The grey dashed line shows a power law proportional to Co1/2.
Current usage metrics show cumulative count of Article Views (full-text article views including HTML views, PDF and ePub downloads, according to the available data) and Abstracts Views on Vision4Press platform.
Data correspond to usage on the plateform after 2015. The current usage metrics is available 48-96 hours after online publication and is updated daily on week days.
Initial download of the metrics may take a while.