Fig. 14.
Download original image
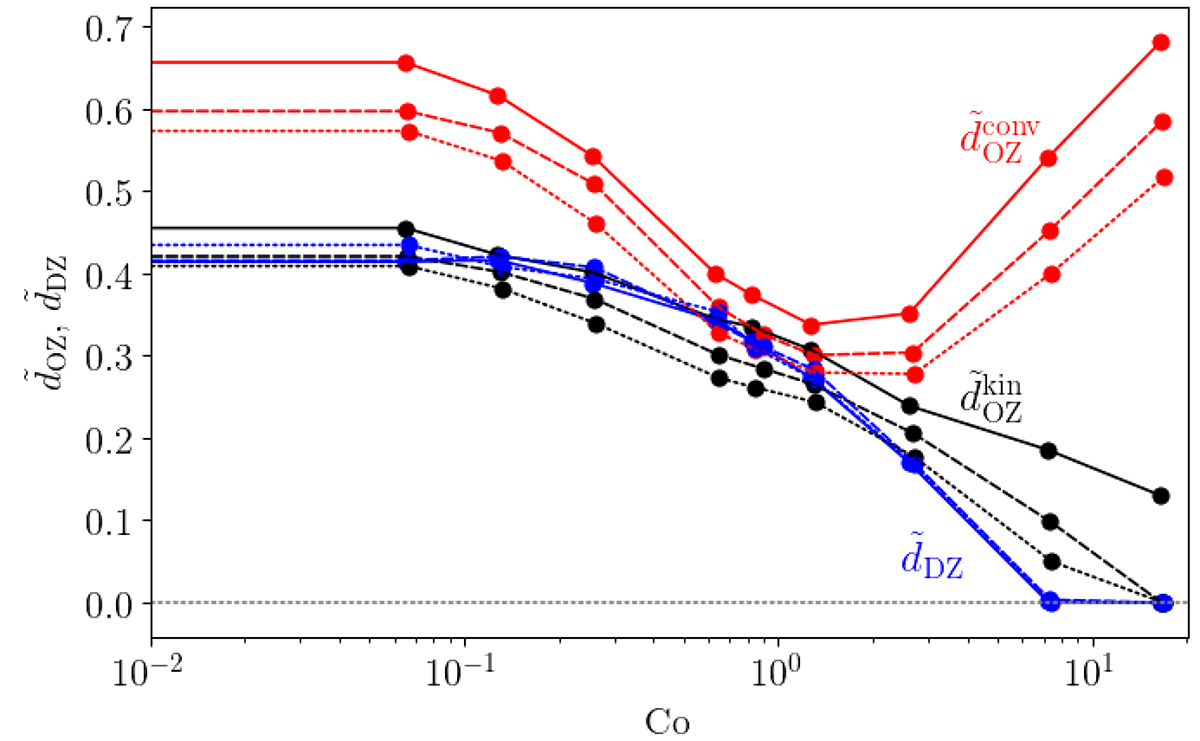
Depth of the overshoot zone from kinetic energy (![]() ; black lines) and convective fluxes (
; black lines) and convective fluxes (![]() ; red), and depth of the Deardorff zone (dDZ; blue) as functions of rotation measured by Co. All quantities have been normalised by the pressure scale height at the base of the CZ. The different lines correspond to the three different values of ℱn or to Sets A (solid lines), B (dashed), and C (dotted).
; red), and depth of the Deardorff zone (dDZ; blue) as functions of rotation measured by Co. All quantities have been normalised by the pressure scale height at the base of the CZ. The different lines correspond to the three different values of ℱn or to Sets A (solid lines), B (dashed), and C (dotted).
Current usage metrics show cumulative count of Article Views (full-text article views including HTML views, PDF and ePub downloads, according to the available data) and Abstracts Views on Vision4Press platform.
Data correspond to usage on the plateform after 2015. The current usage metrics is available 48-96 hours after online publication and is updated daily on week days.
Initial download of the metrics may take a while.