Open Access
Fig. 13.
Download original image
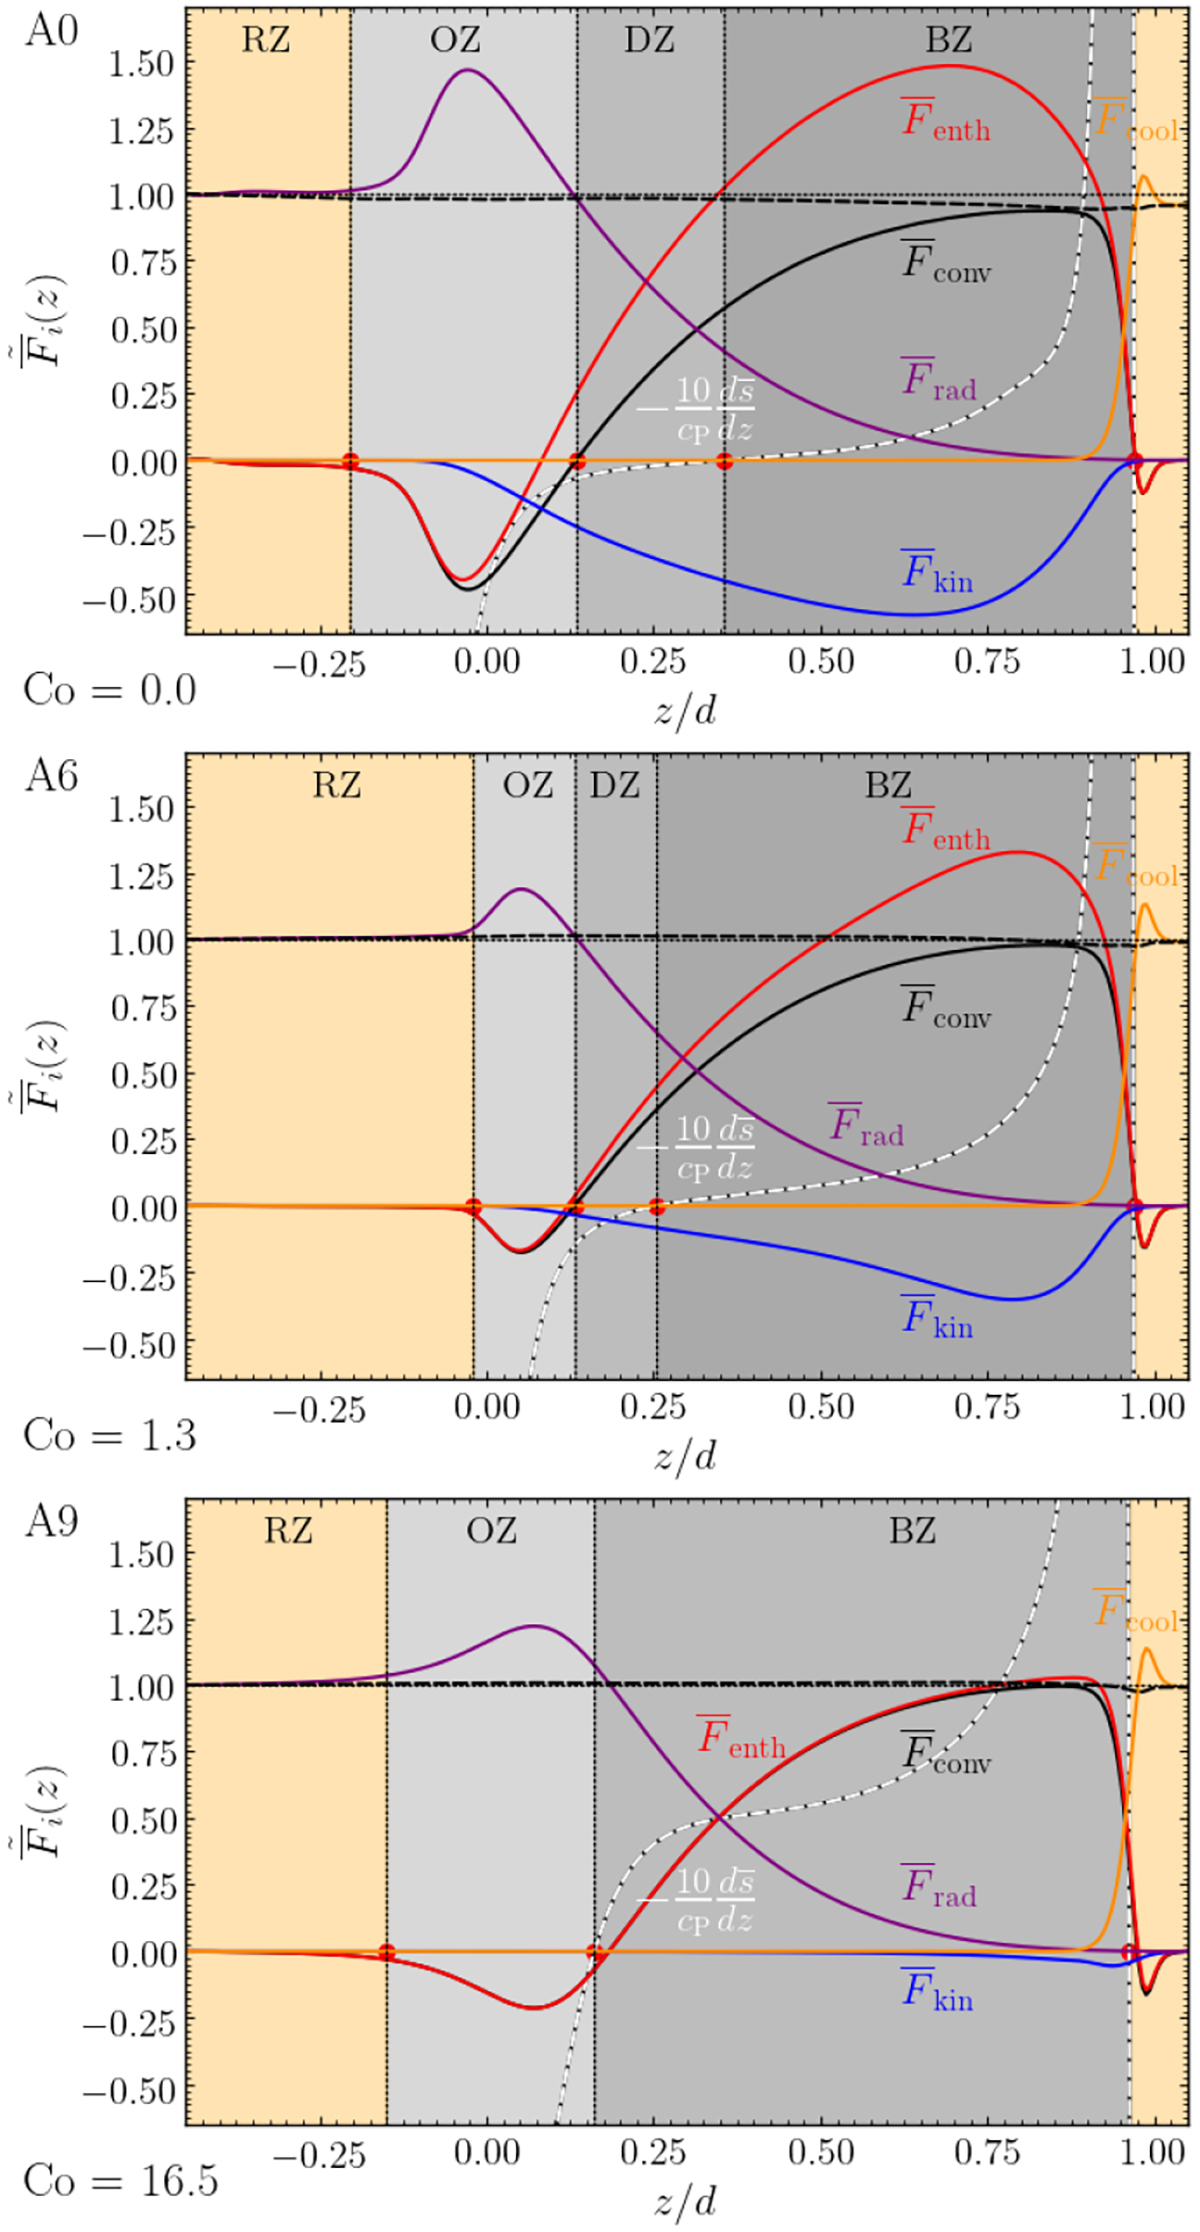
Time-averaged mean energy fluxes as defined in Eqs. (34) and (38) (apart from the negligibly small viscous flux ![]() ) as functions of z from Runs A0, A6, and A9. The red circles indicate (from left to right) the bottoms of OZ, DZ, BZ, and the top of the BZ. The grey (orange) shaded areas indicate mixed (radiative) regions.
) as functions of z from Runs A0, A6, and A9. The red circles indicate (from left to right) the bottoms of OZ, DZ, BZ, and the top of the BZ. The grey (orange) shaded areas indicate mixed (radiative) regions.
Current usage metrics show cumulative count of Article Views (full-text article views including HTML views, PDF and ePub downloads, according to the available data) and Abstracts Views on Vision4Press platform.
Data correspond to usage on the plateform after 2015. The current usage metrics is available 48-96 hours after online publication and is updated daily on week days.
Initial download of the metrics may take a while.