Open Access
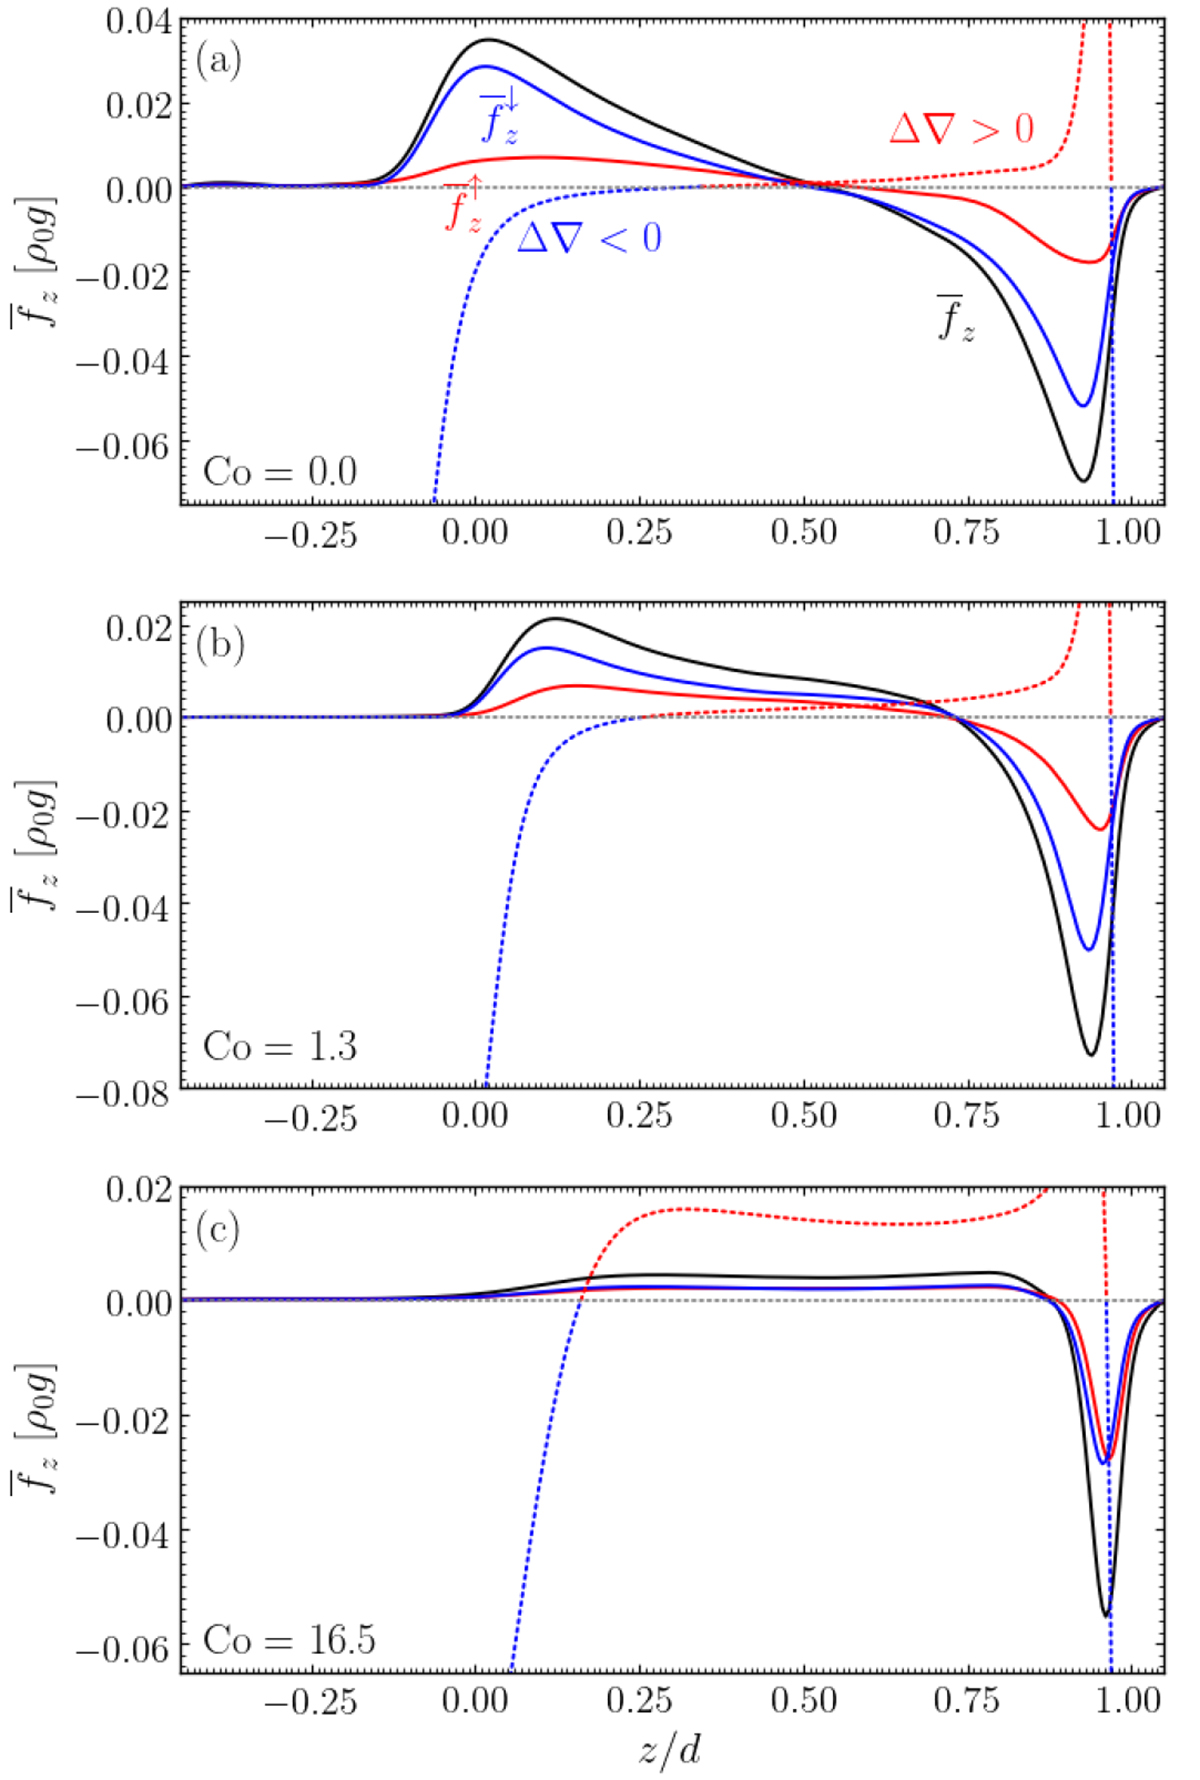
Fig. 12.
Download original image
Horizontally averaged total force (black) and the force acting on upflows (red) and downflows (blue). The dotted red and blue lines show the superadiabatic temperature gradient. Data are shown for (a) a non-rotating Run A0, (b) an intermediate rotation rate (Co = 1.3, Run A6), and (c) for rapid rotation (Co = 16.5, Run A9).
Current usage metrics show cumulative count of Article Views (full-text article views including HTML views, PDF and ePub downloads, according to the available data) and Abstracts Views on Vision4Press platform.
Data correspond to usage on the plateform after 2015. The current usage metrics is available 48-96 hours after online publication and is updated daily on week days.
Initial download of the metrics may take a while.