Fig. 1.
Download original image
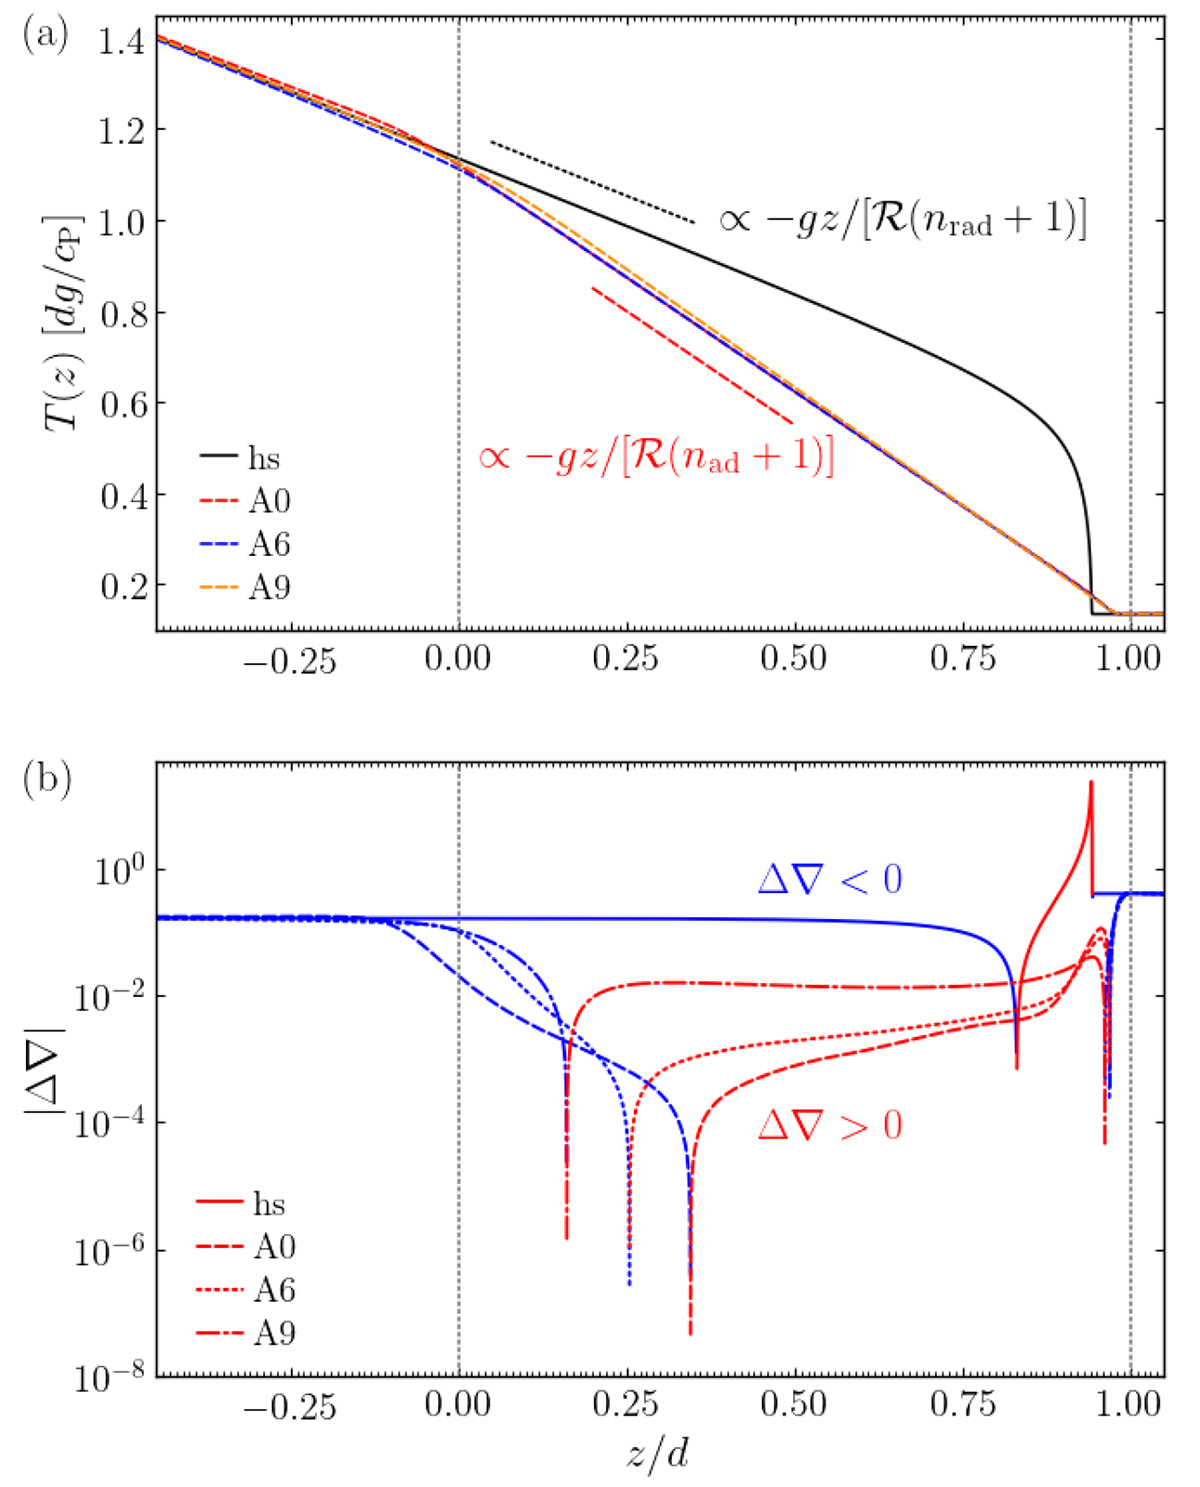
Comparison of hydrostatic and convecting models. Panel a: Temperature as a function of height from a 1D hydrostatic model (black solid line) and convective runs A0 (red dashed line), A6 (blue dashed line), and A9 (orange dashed line). The black (red) dotted line shows a polytropic gradient corresponding to index nrad = 3.25 (nad = 1.5) for reference. Panel b: Absolute value of the superadiabatic temperature gradient Δ∇ from the same runs as indicated by the legend. Red (blue) indicates convectively unstable (stable) stratification. The dotted vertical lines at z = 0 and z/d = 1 denote the base and top of the initially isentropic layer.
Current usage metrics show cumulative count of Article Views (full-text article views including HTML views, PDF and ePub downloads, according to the available data) and Abstracts Views on Vision4Press platform.
Data correspond to usage on the plateform after 2015. The current usage metrics is available 48-96 hours after online publication and is updated daily on week days.
Initial download of the metrics may take a while.