Fig. 3
Download original image
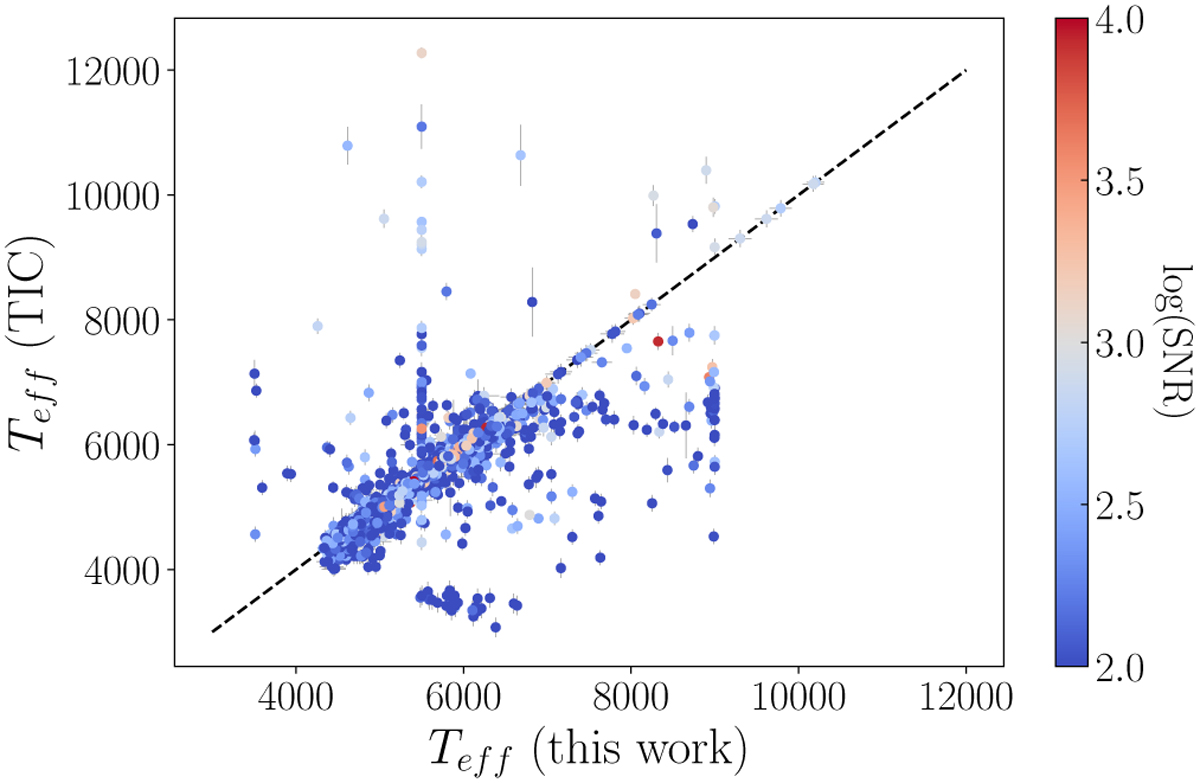
Comparison of the effective temperature with literature values. The y-axis represents the values published in Stassun et al. (2019); Paegert et al. (2021), and the black dashed line represents equality. We note that the apparent tail of deviations towards lower temperatures is comprised of stars for which the RV was not known, and for which the stellar parameter determination failed. All stars with a missing RV value and possible errors in the catalogue are marked via the VFLAG column in our catalogue.
Current usage metrics show cumulative count of Article Views (full-text article views including HTML views, PDF and ePub downloads, according to the available data) and Abstracts Views on Vision4Press platform.
Data correspond to usage on the plateform after 2015. The current usage metrics is available 48-96 hours after online publication and is updated daily on week days.
Initial download of the metrics may take a while.