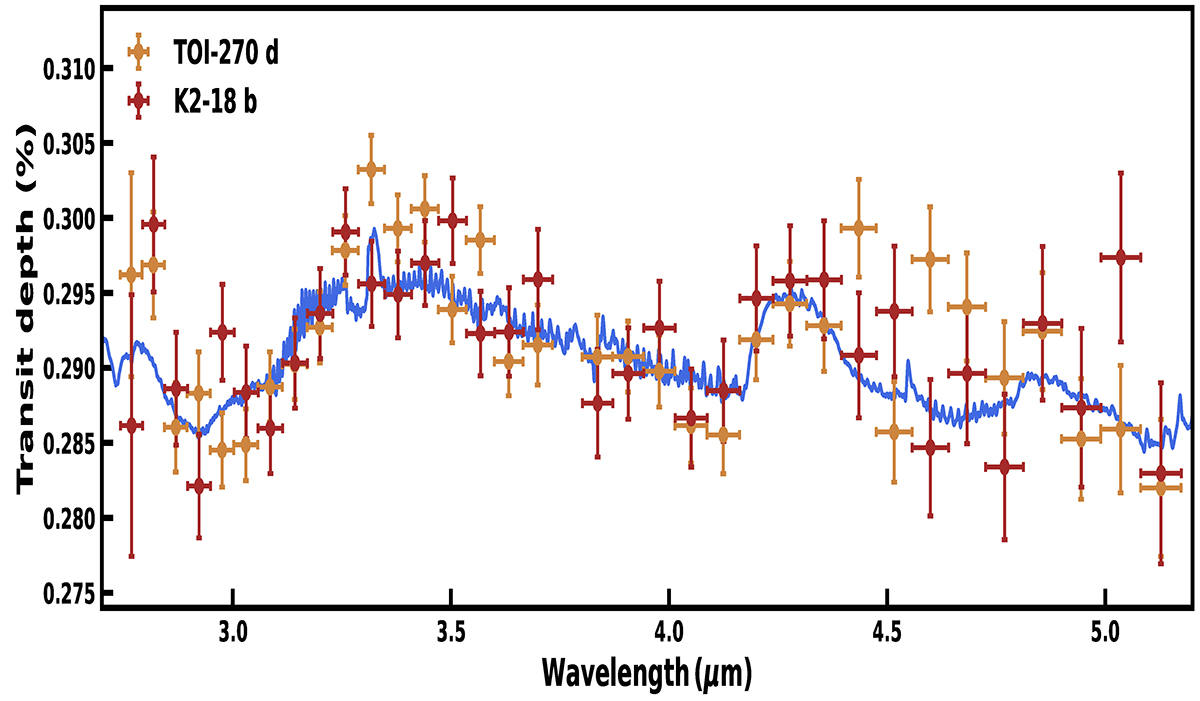
Fig. H.1.
Download original image
Comparison between the transmission spectrum of TOI-270 d and K2-18 b observed with JWST/NIRSpec G395H. The spectra are binned to R ≈ 55 for visual clarity and are shown in orange and dark red, respectively. The K2-18 b spectrum is vertically offset by -41 ppm as discussed in Madhusudhan et al. (2023b). The two spectra show similar spectral features, coming predominantly from the absorption due to CH4 and CO2. The blue curves shows the median retrieved model spectrum obtained with the K2-18 b data from Madhusudhan et al. (2023b).
Current usage metrics show cumulative count of Article Views (full-text article views including HTML views, PDF and ePub downloads, according to the available data) and Abstracts Views on Vision4Press platform.
Data correspond to usage on the plateform after 2015. The current usage metrics is available 48-96 hours after online publication and is updated daily on week days.
Initial download of the metrics may take a while.