Fig. D.1.
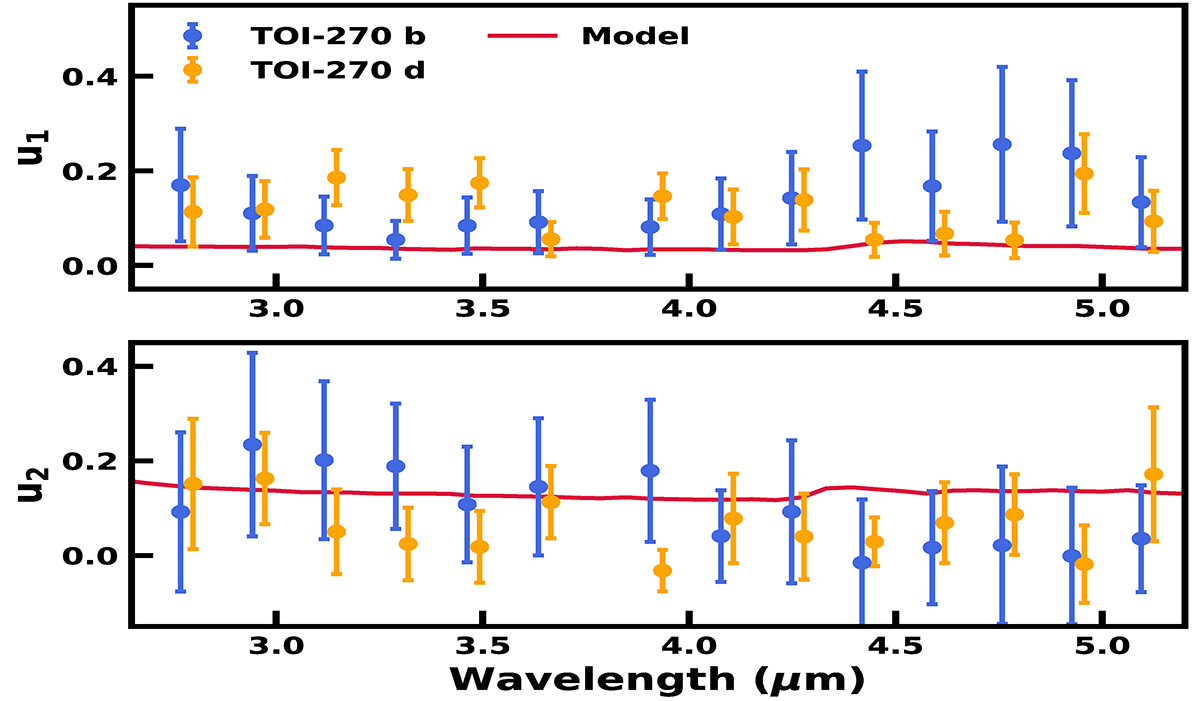
Download original image
Empirical quadratic LDCs of TOI-270. The fitted LDCs from the transit of TOI-270 b and d are shown in blue and orange, respectively. The LDCs obtained from the transit of TOI-270 d are shown with a small wavelength offset for clarity. The red curves show the quadratic LDCs predicted by the ATLAS9 stellar atmosphere models, obtained from ExoCTK. As can be seen, we find some potential differences between the empirical and theoretical LDCs.
Current usage metrics show cumulative count of Article Views (full-text article views including HTML views, PDF and ePub downloads, according to the available data) and Abstracts Views on Vision4Press platform.
Data correspond to usage on the plateform after 2015. The current usage metrics is available 48-96 hours after online publication and is updated daily on week days.
Initial download of the metrics may take a while.