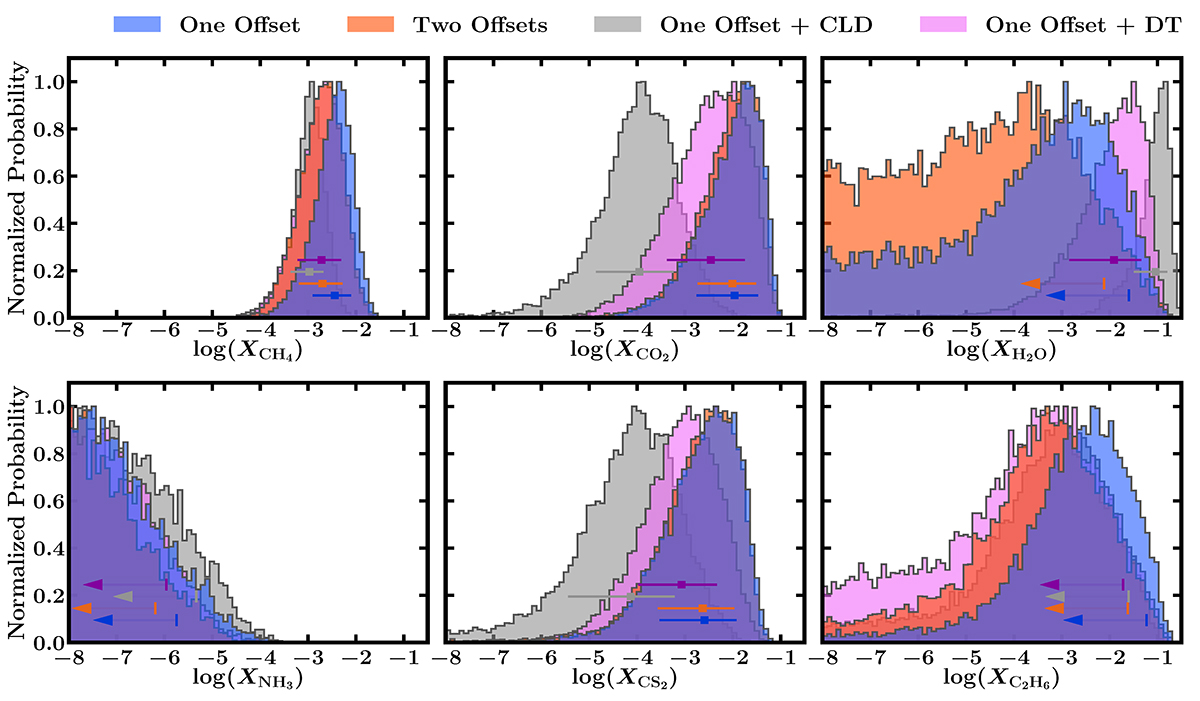
Fig. 3.
Download original image
Retrieved posterior probability distributions for the mixing ratios of prominent molecules, shown for the four cases using WFC3 and NIRSpec data, as described in Sect. 3. The horizontal error bars denote the median and corresponding 1σ interval for each distribution. The arrows in the case of H2O, NH3 and C2H6 indicate 95% upper limits. We infer CH4, CO2, and CS2 at 4.9σ, 3.6σ, and 2.8σ significance, respectively, in the canonical one-offset case with non-grey limb darkening. Abundance estimates and detection significance for these cases are shown in Tables 1 and I.1.
Current usage metrics show cumulative count of Article Views (full-text article views including HTML views, PDF and ePub downloads, according to the available data) and Abstracts Views on Vision4Press platform.
Data correspond to usage on the plateform after 2015. The current usage metrics is available 48-96 hours after online publication and is updated daily on week days.
Initial download of the metrics may take a while.