Fig. 2.
Download original image
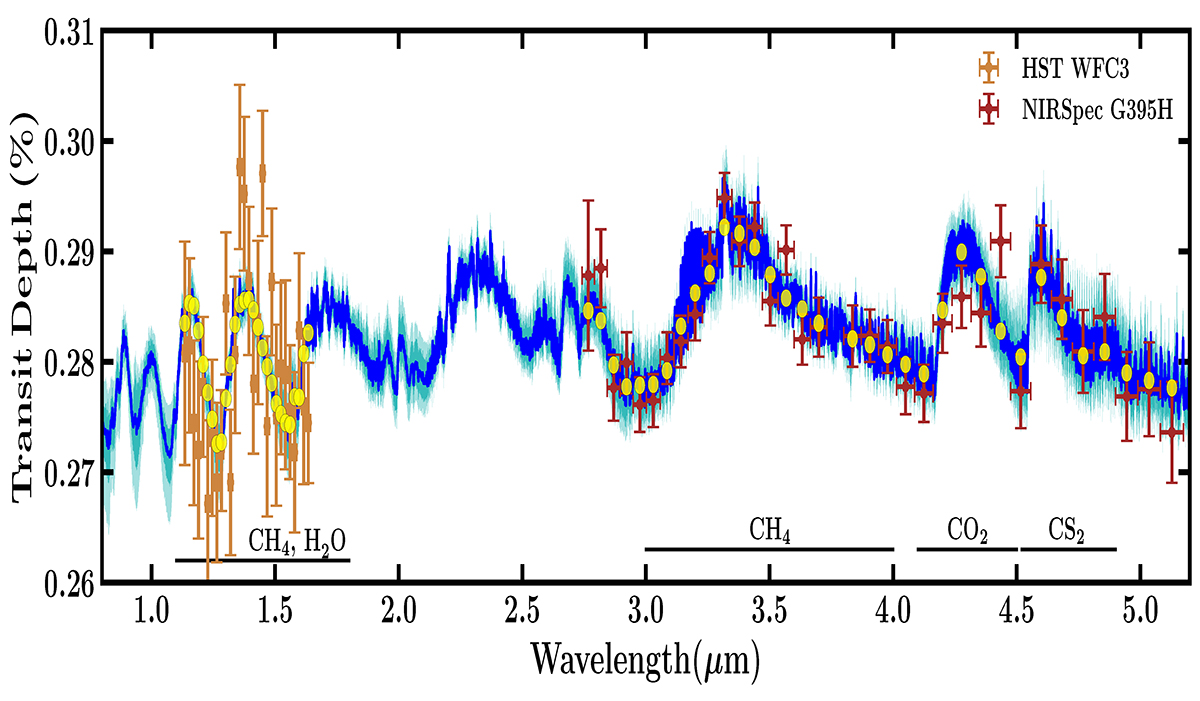
Transmission spectrum of TOI-270 d observed with JWST/NIRSpec G395H and HST/WFC3. The NIRSpec G395H spectrum between 2.7–5.2 μm, from this work, is shown in dark red, binned to R ≈ 55 for visual clarity. The WFC3 spectrum is shown in orange and spans 1.1–1.6 μm, reported by Mikal-Evans et al. (2023). The retrieval is performed using the native resolution NIRSpec G395H spectrum (R ∼ 2700) and the WFC3 spectrum. The NIRSpec spectrum is vertically offset by −84 ppm, corresponding to the median retrieved offset in the canonical one-offset case. The blue curve shows the median retrieved model spectrum, while the medium- and lighter-blue contours denote the 1σ and 2σ intervals, respectively. Yellow points correspond to the median spectrum binned to match the observations. The prominent molecules responsible for the features in different spectral regions are labelled.
Current usage metrics show cumulative count of Article Views (full-text article views including HTML views, PDF and ePub downloads, according to the available data) and Abstracts Views on Vision4Press platform.
Data correspond to usage on the plateform after 2015. The current usage metrics is available 48-96 hours after online publication and is updated daily on week days.
Initial download of the metrics may take a while.