Fig. 1.
Download original image
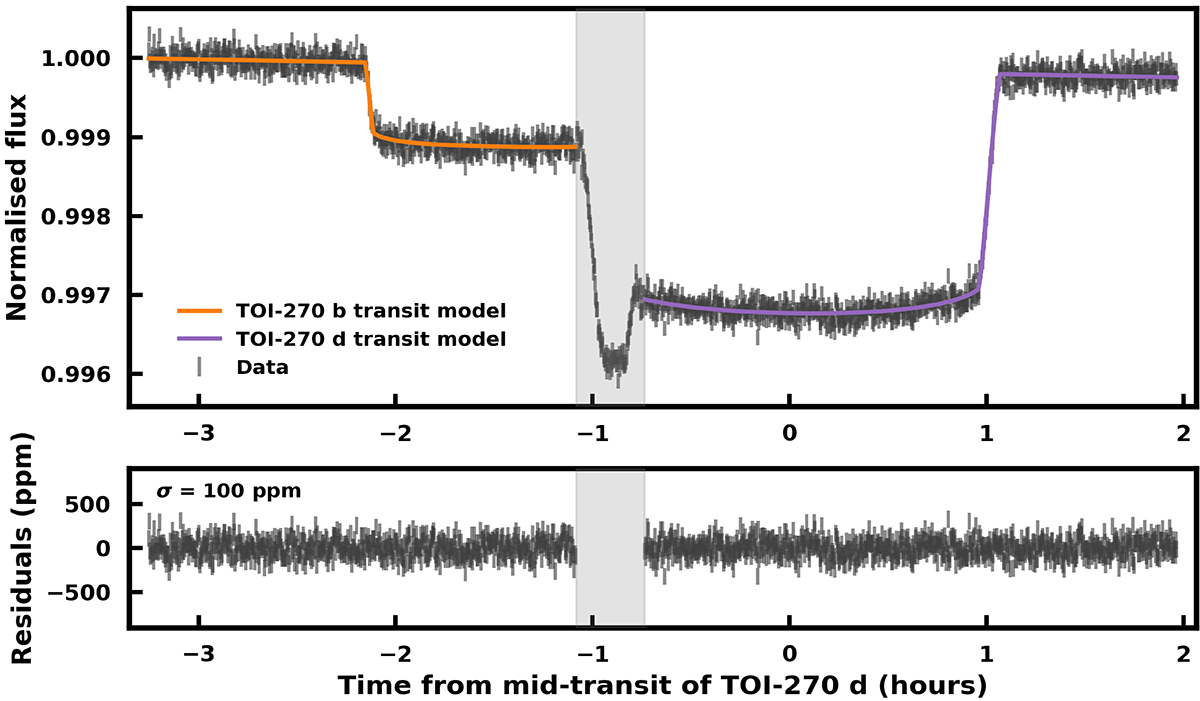
White light curve for the simultaneous transits of TOI-270 b and d observed with JWST NIRSpec G395H. The top panel shows the combined white light curve from NRS1 and NRS2, together with the best-fit models of the two transits shown in orange and purple. We mask the overlap region from the model fitting, indicated in grey. In both cases, we fit the transits using the out-of-transit flux on both sides. The bottom panel shows the residuals after subtracting the best-fit models. The standard deviation of the residuals is 100 ppm, corresponding to 1.2 times the expected noise level, similarly to other NIRSpec G395H observations.
Current usage metrics show cumulative count of Article Views (full-text article views including HTML views, PDF and ePub downloads, according to the available data) and Abstracts Views on Vision4Press platform.
Data correspond to usage on the plateform after 2015. The current usage metrics is available 48-96 hours after online publication and is updated daily on week days.
Initial download of the metrics may take a while.