Fig. 5
Download original image
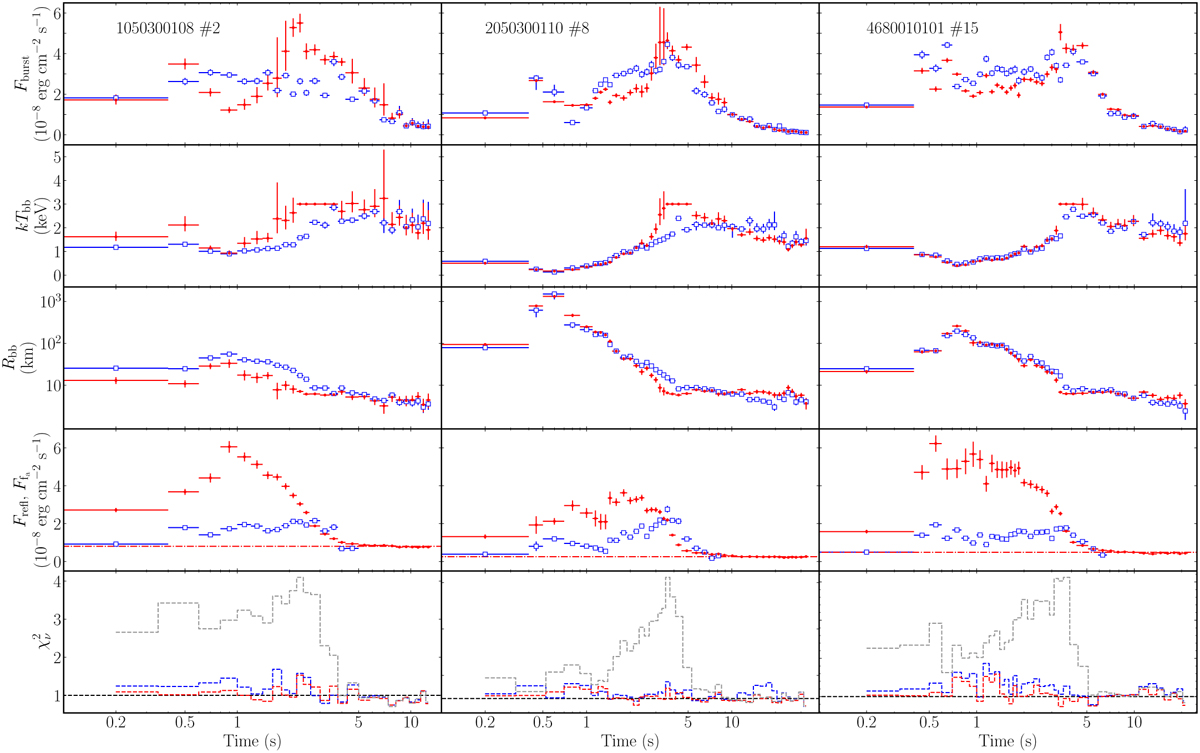
Time-resolved spectroscopy using the fa model (red dot) and the disk reflection model (blue square) for bursts #2 (left column), #8 (middle column), and #15 (right column). Shown in each column, from top to bottom, are the burst bolometric flux, Fburst; the blackbody temperature, kTbb, the blackbody radii, Rbb, which were calculated using a distance of 8.4 kpc; the enhanced persistent emission flux and disk reflection flux, ![]() and Fred, respectively; and the goodness of fit per degree of freedom,
and Fred, respectively; and the goodness of fit per degree of freedom, ![]() . The red dash-dotted lines represent the persistent emission level. The
. The red dash-dotted lines represent the persistent emission level. The ![]() of the blackbody model are plotted as gray dashed lines for comparison.
of the blackbody model are plotted as gray dashed lines for comparison.
Current usage metrics show cumulative count of Article Views (full-text article views including HTML views, PDF and ePub downloads, according to the available data) and Abstracts Views on Vision4Press platform.
Data correspond to usage on the plateform after 2015. The current usage metrics is available 48-96 hours after online publication and is updated daily on week days.
Initial download of the metrics may take a while.