Fig. 4
Download original image
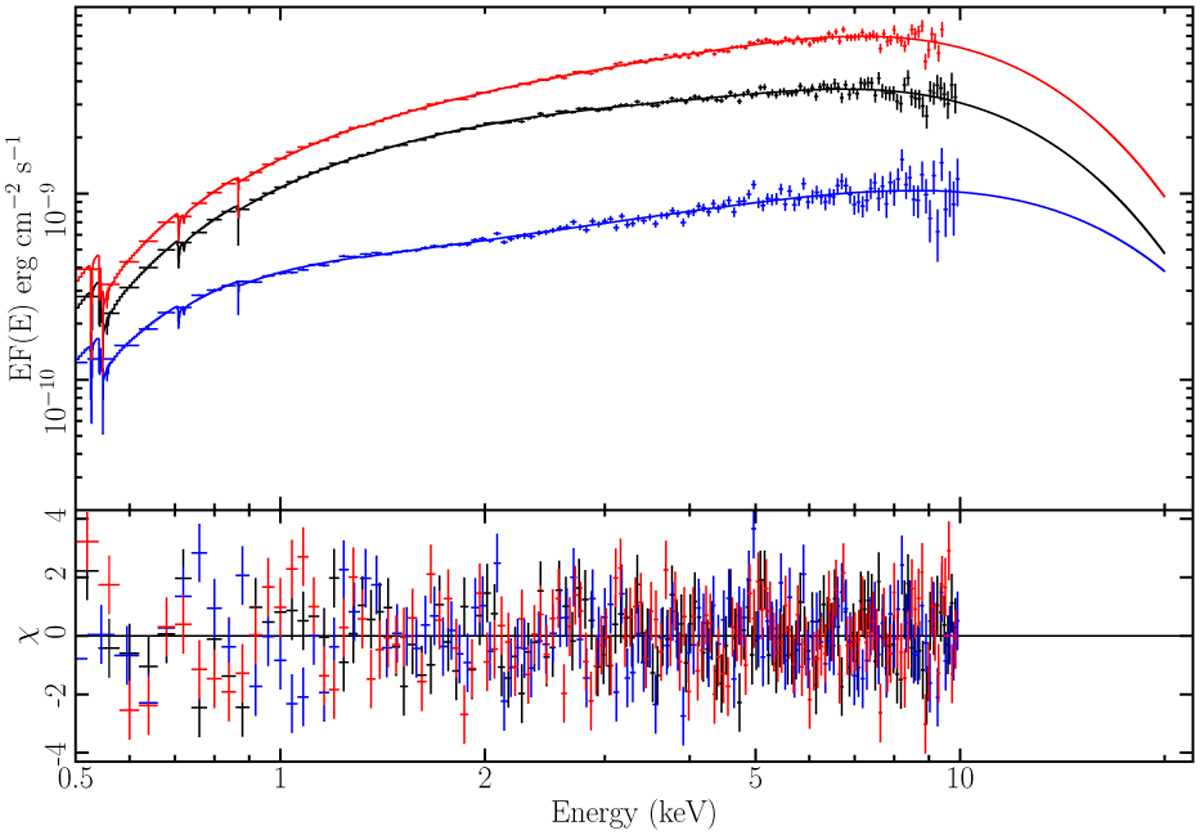
Persistent spectra and their best fitted models of 4U 1820–30. Top panel (from top to bottom): persistent spectra from the right and middle of HID, and prior to burst #8. The best-fit models, Tbabs × (bbodyrad + compTT), are represented as solid lines for each spectrum. Bottom panel: residuals of the best-fit models to the spectra.
Current usage metrics show cumulative count of Article Views (full-text article views including HTML views, PDF and ePub downloads, according to the available data) and Abstracts Views on Vision4Press platform.
Data correspond to usage on the plateform after 2015. The current usage metrics is available 48-96 hours after online publication and is updated daily on week days.
Initial download of the metrics may take a while.