Fig. 1
Download original image
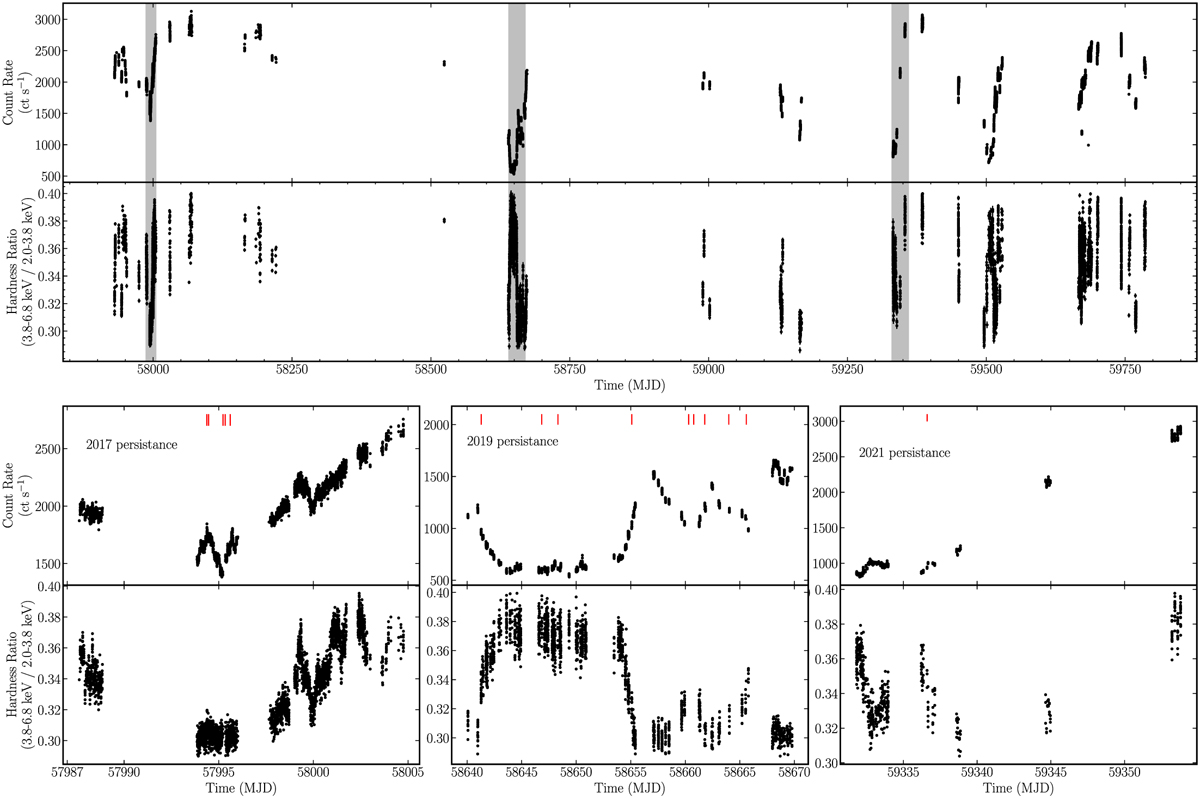
Light curve and hardness of 4U 1820–30 observed by NICER from 2017 to 2022. The top panel shows the light curve in the 0.5–10 keV and the hardness ratio between 3.8–6.8 keV and the 2.0–3.8 keV. Each black point means 64 s of data from NICER, and all bursts are removed. The gray intervals cover the X-ray bursts, which correspond to three panels at the bottom. In the bottom panel, from left to right, are plotted the persistent emissions and the hardness ratios between MJD 57 987–58 005, 58 640–58 670, and 59 330–59 360. We indicate the onset of all bursts with red bars.
Current usage metrics show cumulative count of Article Views (full-text article views including HTML views, PDF and ePub downloads, according to the available data) and Abstracts Views on Vision4Press platform.
Data correspond to usage on the plateform after 2015. The current usage metrics is available 48-96 hours after online publication and is updated daily on week days.
Initial download of the metrics may take a while.