Open Access
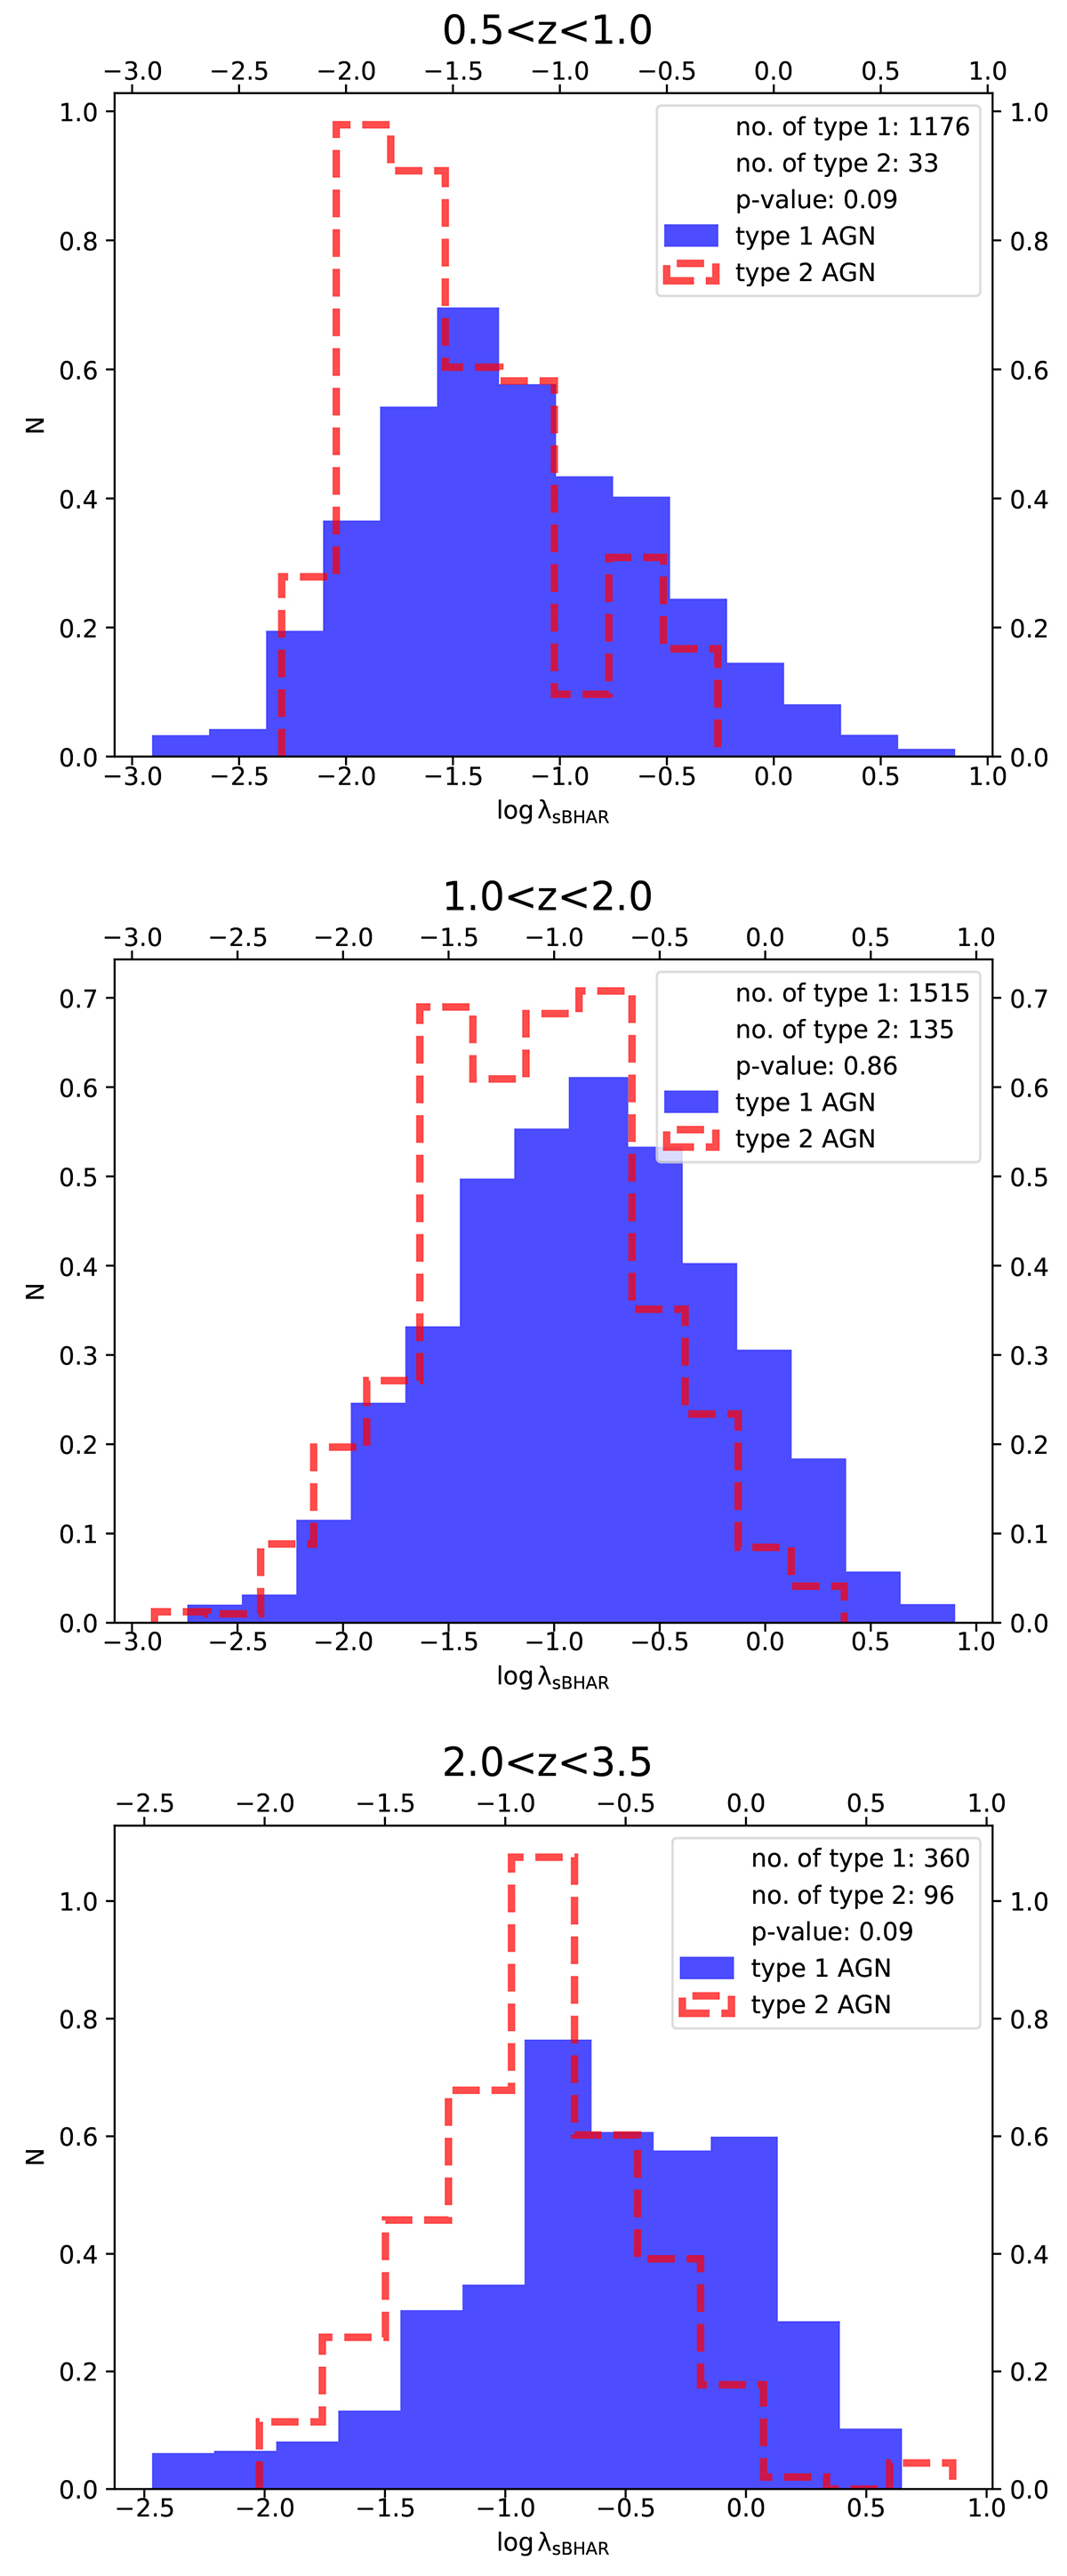
Fig. 4.
Download original image
Distributions of λsBHAR of type 1 (shaded blue histogram) and type 2 (dashed red histogram) at different redshift intervals, as is indicated in the title of each panel. The distributions were weighted to account for the different LX and redshift of the two AGN populations (see text for more details).
Current usage metrics show cumulative count of Article Views (full-text article views including HTML views, PDF and ePub downloads, according to the available data) and Abstracts Views on Vision4Press platform.
Data correspond to usage on the plateform after 2015. The current usage metrics is available 48-96 hours after online publication and is updated daily on week days.
Initial download of the metrics may take a while.