| Issue |
A&A
Volume 683, March 2024
|
|
|---|---|---|
| Article Number | A120 | |
| Number of page(s) | 7 | |
| Section | Extragalactic astronomy | |
| DOI | https://doi.org/10.1051/0004-6361/202348146 | |
| Published online | 13 March 2024 | |
Active galactic nuclei and gravitational redshifts
1
Instituto de Astronomía Teórica y Experimental (IATE), CONICET – U. Nacional de Córdoba, X5000BGR Córdoba, Argentina
e-mail: nelson.padilla@unc.edu.ar
2
Instituto de Física, Universidade Federal da Bahia, 40210-340 Salvador, BA, Brazil
3
Observatório Nacional, 20921-400 Rio de Janeiro, RJ, Brazil
4
Institut de Física d’Altes Energies, The Barcelona Institute of Science and Technology, Campus UAB, 08193 Bellaterra, Barcelona, Spain
5
Observatorio Astronómico de Córdoba, Universidad Nacional de Córdoba, X5000BGR Córdoba, Argentina
Received:
3
October
2023
Accepted:
20
December
2023
Context. Gravitational redshift is a classical effect of General Relativity. It has been measured in stars, quasars, and clusters of galaxies.
Aims. We identify the signature of gravitational redshift in the emission lines of active galaxies that is caused by supermassive black holes and compare this signature to what is found for inactive galaxies.
Methods. Using the virial theorem, we estimated gravitational redshifts for quasars from the 14th data release (DR14) of the Sloan Digital Sky Survey (SDSS) and compared them with measured gravitational redshifts from the difference between the redshifts of emission lines of Sydney Australian Astronomical Observatory Multi-object Integral Field (SAMI) galaxies in the central and outer annuli of their integral field spectra.
Results. Firstly, from the full width at half maximum of Hβ lines of 57 Seyfert type I galaxies of the active galactic nucleus (AGN) Black Hole Mass Database, we derive a median gravitational redshift zg = 1.18 × 10⁻⁴. Expanding this analysis to 86 755 quasars from DR14 of SDSS, we have a median value zg = 1.52 × 10⁻⁴. Then, by comparing the redshifts of 34 lines measured in the central and outer regions of low-ionization nuclear emission-line region galaxies in the SAMI survey, we obtain zg = (0.68 ± 0.09)×10−4, which increases to zg = (1.0 ± 0.1)×10−4 for the Hα and Hβ lines. These numbers are compatible with central black holes of ∼109 solar masses and broad line regions of ∼1 pc. For non-AGN galaxies, the gravitational redshift is compatible with zero.
Key words: relativistic processes / galaxies: active / galaxies: Seyfert
Publisher note: The inappropriate sentences in the first paragraph of Section 2 (accidentally left inserted) were deleted on 27 September 2024.
© The Authors 2024
 Open Access article, published by EDP Sciences, under the terms of the Creative Commons Attribution License (https://creativecommons.org/licenses/by/4.0), which permits unrestricted use, distribution, and reproduction in any medium, provided the original work is properly cited.
This article is published in open access under the Subscribe to Open model. Subscribe to A&A to support open access publication.
1. Introduction
Gravitational redshifts have been measured in stars, quasars (Mediavilla et al. 2018; Mediavilla & Jiménez-Vicente 2021), and galaxy clusters (Wojtak et al. 2011; Mpetha et al. 2021; Rosselli et al. 2023). A white dwarf of Chandrasekhar mass, for example, has a radius bounded by R < 0.01 R⊙, which leads to a lower limit for its gravitational redshift zg ∼ 1.4 × 10⁻⁴. When galaxies are inhabited by supermassive black holes (SMBH), their gravitational redshift can affect light that is emitted from the galactic bulges, and we show below that the gravitational redshift can also be as high as 10−4 in the case of active galactic nucleus (AGN) hosts.
The signature of gravitational redshifts in galaxy emission lines would constitute an additional confirmation of General Relativity, and it has been detected, for instance, in Fe IIIλλ2039−2113 lines of quasars (Mediavilla et al. 2018; Mediavilla & Jiménez-Vicente 2021). Gravitational redshift in quasar emission lines has also been reported in Bon et al. (2015), and its signature was also found in the iron Kα (Nandra et al. 1997) and Hα (Eun et al. 2017) emission lines of Seyfert type 1 galaxies.
We also attempt to show a signature of SMBH gravitational redshift in galaxy emission lines, concentrating mostly on Low-ionization nuclear emission-line region (LINER) and non-AGN galaxies by directly comparing the measured redshifts in the central and outer regions of extended galaxies. Taking into account possible sources of systematics, we infer gravitational redshifts for these galaxies and compare them with those estimated for quasars and Seyfert type I galaxies.
This work is organized as follows. In Sect. 2, we first indirectly compute the gravitational redshift of Seyfert type I galaxies of the AGN Black Hole Mass Database (Bentz & Katz 2015), from the full width at half maximum (FWHM) of hydrogen lines. The study is then extended to about 80 000 quasars of the 14th data release of the Sloan Digital Sky Survey. In Sect. 3, a direct measurement is performed through a comparison of redshifts of lines emitted from the outer and central regions of galaxies of the Sydney Australian Astronomical Observatory Multi-object Integral Field (SAMI; Croom et al. 2021) catalog because we expect the effect of the gravitational redshift of a central SMBH to contaminate only the central regions of well-resolved galaxies. Section 4 studies whether the systematic error introduced by the gravitational redshift of the SMBH in AGN galaxies can affect estimations of the cosmological parameters. In the last section, we discuss the results and outline our conclusions.
2. Gravitational redshifts of AGN and quasars
We begin with a statistical analysis of the gravitational redshifts of active galactic nuclei (AGNs) inferred from the FWHM of the Hβ emission lines. Applying Kepler’s law to the accretion disk of a central SMBH of mass M, we find the following gravitational redshift (Bentz & Katz 2015):
where R is the distance from the emission region to the central SMBH, and v/c is the rotational linear velocity of gas in that region in units of the speed of light, which is typically measured from the FWHM of the emission line. The statistical factor f, typically of about unity, is related to uncertainties in the distribution and shape of the emitting clouds and relativistic corrections.
In this way, by directly computing the right-hand side of Eq. (1) from the measured FWHM, we show in Fig. 1 the distribution of gravitational redshifts for 57 Seyfert I galaxies inferred from the FWHM measurements of the Hβ lines of the AGN Black Hole Mass Database (Bentz & Katz 2015) for f = 1 (dashed line), for which we find a median value of zg ≃ 1.18 × 10⁻⁴. The solid line shows the analysis of 86 755 quasars from DR14 of SDSS with FWHM measurements of Hβ (Rakshit et al. 2020), finding a median value zg ≃ 1.52 × 10⁻⁴. In both cases, the dispersion around the typical inferred gravitational redshifts is similar, reflecting a similar variety of AGNs in both samples. These figures should still be considered with caution because of the uncertainties involved in the use of the FWHM of hydrogen lines to estimate the masses of central black holes (e.g., Marziani et al. 2013).
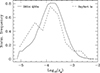 |
Fig. 1. Normalized distributions of gravitational redshifts indirectly derived from the FWHM of Hβ broad lines of SDSS DR14 quasars (Rakshit et al. 2020, solid), and of Hβ broad lines of 57 Seyfert type I galaxies cataloged in the AGN Black Hole Mass Database (Bentz & Katz 2015, dashed lines). The median and dispersion of the distribution for the SDSS DR14 quasars are median(zg) = 1.52 × 10⁻⁴, and Std(log10(zg)) = 0.49, and for the AGN Black Hole Mass Database, they are median(zg) = 1.18 × 10⁻⁴, and Std(log10(zg)) = 0.58. |
The broad-line region dominates the luminosity in the center of broad-line AGNs and QSOs, where spectroscopy fibres are usually placed to measure galaxy redshifts. This suggests that broad-line AGN and QSO redshifts are biased due to the SMBH gravitational redshift.
For galaxies with lower or without nuclear activity (narrow-line AGN, LINERs, or non-AGN galaxies), this contamination can be even negligible, especially if the galaxy has no active nucleus. This applies to the majority of the cases. It might still be significant in narrow-line AGN and LINERs. We present an attempt to directly identify a signature of gravitational redshift in the latter types of galaxies, which is per se of astrophysical interest.
3. Gravitational redshift in emission lines
With this goal in mind, we used a compilation of galaxies from the third data release of the Sydney Australian Astronomical Observatory Multi-object Integral Field (SAMI; Croom et al. 2021) to directly measure the effect of the gravitational redshift in the region surrounding SMBHs, particularly by studying central and outer regions of galaxies.
Because the SAMI galaxy survey is an integral field spectroscopy survey, the galaxies in our sample are nearby and are spatially well resolved, which allows us to obtain spectra with a high signal-to-noise ratio of extended galaxies. The SAMI spectrograph has two arms for the blue and red wavelengths, spanning the ranges 3700 − 5700 and 6250 − 7350 Å, with a resolution of σ = 70 km s−1 and σ = 30 km s−1, respectively. SAMI provides datacubes with a diameter of 15 arcsec in an array of 50 × 50 interpolated spaxels (spectra per projected pixel), which are further processed into annular averaged spectra at different radii from the galaxy center by the SAMI team, with a central spectrum averaged within a disk of 1.5 arcsec radius (equivalent to 1.3 kpc at the median redshift of the sample z = 0.043), and within annuli increasing in radius in intervals of 3 arcsec.
We measured the redshift for individual emission lines in the central annulus and in the third annulus centered at 7.5 arcsec, which is far enough from the center to avoid contamination from it by atmospheric seeing and the point spread function of the observations, but the signal-to-noise ratio is high enough for us to be able to confidently detect emission lines. For simplicity, in what follows, we refer to the third annulus as the outer annulus.
We concentrated on galaxies with high axial ratios (face-on galaxies with ⟨b/a⟩≃0.8) because we are interested in annular averaged spectra. The spectra of galaxies selected this way are more reliable and have higher total line luminosities. Whenever possible, we also restricted our selection to galaxies with detectable line emission out to the outer limits of the SAMI field of view to be able to measure redshifts in the external parts of galaxies (up to the fourth annulus). Because AGN galaxies are less frequent, we relaxed these criteria to allow a larger number of AGN galaxies. We additionally required that the emission lines of all galaxies that entered our SAMI sample were well fit by single Gaussians, that is, with as little systematic effects from galaxy kinematics as possible, because the latter frequently produces composite or double emission lines that can be especially prominent farther away from the galaxy center and can affect FWHM measurements. Our final sample contains 40 galaxies, 9 of which show clear AGN signatures according to the Baldwin et al. (1981) diagram using the Kauffmann et al. (2003) limits (8 of which are LINERs, and one is a Seyfert II galaxy), 9 are starbursts (HII), and the rest are composite galaxies, that is, starbursts plus AGN, although we refer to them simply as non-AGN. Given the multiple and flexible selection criteria we needed to adopt to construct these samples, we provide the list of SAMI IDs and the classification diagrams in the appendix. We employed the SPLOT routine within IRAF to fit a total of 306 emission lines that can be detected both in the central and outer annuli of our sample.
We fit Gaussians to the individual lines [OII]3727, Hβ, [OIII]4959, [OIII]5007, [OI]6300, [NII]6548, Hα, [NII]6583, [SII]6717, and [SII]6731 whenever any of these was available in a spectrum. Figure 2 shows an example spectrum for galaxy S372374 in the two top panels for the blue and red arms of the spectrograph, respectively. The bottom panel shows two examples of fits to [OIII] and Hα lines, with the recovered values of the FHWM.
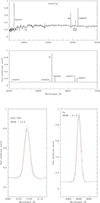 |
Fig. 2. Example spectrum for galaxy S372374 in the blue (top) and red arms of the SAMI spectrograph (middle). The different lines used in our analysis are indicated in the spectrum. The bottom panels show two example fits (red dashed lines) for which we used Gaussian functions via the SPLOT routine in IRAF. |
The zg was found by subtracting the redshift measured at the outer annulus of these AGN and non-AGN galaxies samples from those measured in the central annulus, using the same rest-frame wavelength emission lines.
We adopted this method because it allows us to estimate errors statistically, as shown below. We also verified that using the average inner and outer redshifts over all available lines provides consistent results. Because the zg for the Seyfert II galaxy in our sample is consistent with zero, as expected for this type of AGN galaxy, we only considered LINERS as our AGN sample.
We devised a method for estimating errors that takes advantage of multiple measurements of the redshift of the same emission line in individual galaxies. We also compared the resulting galaxy central redshifts with those quoted by the GAMA survey as a consistency check. We estimated the error of our measured gravitational redshifts Δz = zcentral − zouter by calculating this difference for different emission lines and measuring the standard deviation within individual galaxies. We did this only when single galaxies allowed measurement of multiple emission lines of equal rest-frame wavelength in both the inner and outer annuli. The histograms of Fig. 3 show the distribution of deviations of Δz around the mean obtained from emission lines in individual galaxies in our AGN and non-AGN samples (solid and dashed lines, respectively). The legend shows the estimated error calculated by dividing the dispersion of Δz by the square root of the number of galaxies for which this measurement was possible. As the resolution of the red arm of the SAMI spectroscopic instrument is about twice that of the blue arm, it is not surprising that when only red lines are considered (lower panel), the error of ⟨Δz⟩ is lower than that derived with the blue and red lines together, at least for the more numerous non-AGN galaxy sample. For this reason, we only included lines with a wavelength above 6000 Å in our analysis.
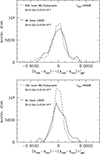 |
Fig. 3. Distribution functions of the variation in zg for (LINER) and non-AGN (SB/composite) lines within individual galaxies. The legend shows the error on the mean of the distribution, which we assigned as the error in the measured redshift differences for the different samples. Top: results from using all available lines. Bottom: same for red lines alone. Their spectral resolution is better. |
We show in Fig. 4 the relation between Δz and FWHM of the emission lines measured in the inner annulus (solid dots indicate AGN galaxies, and open circles non-AGN galaxies). Broader lines show a clear tendency to have a larger redshift difference, which, for the reasons outlined below, we interpret as gravitational redshift contamination in the nucleus of about 10−4. This tendency is only slightly sharper for AGN galaxies (The dispersion around the fit for LINERs is about half that for SB for FWHM < 250 km s−1). These data can be reasonably well fit by a straight line with slope 2, that is, the theoretical dependence zg ∝ v2 given in Eq. (1). We were unable to perform a fully automatic fit on these data given the large dispersion in the distribution. However, we fit the amplitude, which we refer to in our discussion below.
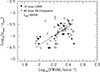 |
Fig. 4. Correlation zg × FWHM for LINER (solid dots) and SB/composite (empty dots) galaxies. The gravitational redshift zg is given by the difference zcentral − zout between the redshifts of each line measured in the central and outer regions. The FWHMs are measured at the inner annulus. The line shows a fit following Eq. (1), where only the amplitude is fitted to the points, corresponding to ffit ∼ 400. |
Figure 4 is restricted to cases for which a positive gravitational redshift signature was found, but as we show next, in an important fraction of cases, the redshift is higher in the outer region.
We now focus on the measured gravitational redshifts in our SAMI samples. The upper panel of Fig. 5 shows Δz = zcentral − zouter for AGN and non-AGN galaxies. When we interpret this redshift difference as being exclusively of gravitational origin, the mean gravitational redshift of the AGN sample (solid line) is zg = (0.68 ± 0.09)×10−4.
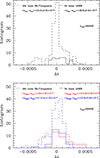 |
Fig. 5. Histograms of zcentral − zout for LINER and non-AGN galaxies (upper panel). In the lower panel, we also show the histograms for zGAMA − zout and zGAMA − zcentral. In this panel, the size of the bin for the GAMA LINER comparison is twice as large than in the other histograms in this figure to reduce noise. |
On the other hand, for non-AGN galaxies (dashed line), we obtain a result that is almost compatible with zero. No significant gravitational redshift is expected for the latter. In the absence of an AGN, the effect of the galaxy gravitational redshift is extended over the entire galaxy. As the ratio of the BLR radius and the half-light radius is typically < 10−3, while the ratio of the central SMBH mass and the mass of the host bulge is typically ∼10−2 (Magorrian et al. 1998), the resulting redshift is an order of magnitude lower at least. That is, the gravitational redshift for a typical non-AGN galaxy is < 10−5, which is below the precision we can achieve, and this number is not altered even when we include a non-active SMBH.
Our interpretation of Δz as a gravitational redshift is further supported by the redshift differences between the third and fourth annuli, which we measured whenever possible. In this case, we find that the mean values are compatible with zero for both AGN and non-AGN. This result confirms that the redshift difference has its origin in the central region. The use of the second annulus, on the other hand, has not led to conclusive results because complex kinematics simultaneously affect both the nucleus and the galactic disk.
The parent galaxy sample of SAMI is the Galaxy and Mass Assembly catalog (GAMA; Liske et al. 2015), which allows us to compare our IRAF-SPLOT obtained estimates of SAMI galaxy redshifts with the automated redshift measurement of the GAMA survey. GAMA uses a single-fibre spectrograph with a diameter of 2 arcsec. This is slightly smaller than the central 3 arcsec disk used in our SAMI calculations. In the lower panel of Fig. 5, we also present histograms for the differences zGAMA − zout and zGAMA − zcentral, where zGAMA is measured with a central single fibre. Our SAMI central measurements are clearly consistent with the GAMA redshifts, and the offset between central and outer redshifts we find in SAMI is confirmed. These redshift difference measurements are summarised in Table 1. For non-AGN galaxies, the SAMI central redshifts and the GAMA redshifts are consistent within the errors, whereas for AGN galaxies, the SAMI redshift is a factor ∼2/3 lower, and just outside the estimated error. Because the GAMA fibres cover a nuclear area that is (2/3)2 smaller than the SAMI central annulus, this small difference in the measured gravitational redshift is in fact expected for AGN if there is a systematic effect from the SMBH zg.
Redshift differences between the central and outer annuli as obtained from SAMI data and from adopting the GAMA redshift as the central redshift.
These results suggest that the SMBH gravitational redshift is negligible for non-AGN galaxies, which correspond to the majority of our galaxies, as expected, because they are more common than AGN or LINERs (Bongiorno et al. 2016). On the other hand, for AGN galaxies, we find a gravitational redshift signature consistent with the analysis of the FWHM of broad-line AGNs and quasars of Sect. 2.
We also verified the consistency of our measurements by only using the redshifts of Hα and Hβ lines. In this case, we obtain a slightly higher mean value of the systematic for AGN galaxies, zcentral − zout = (1.0 ± 0.1)×10−4. As these lines are mainly emitted from the broad-line region, this result strongly suggests that we indeed measure a gravitational redshift and not an unknown systematic.
4. Cosmological consequences of gravitational redshifts caused by SMBHs
The estimation of cosmological parameters from supernovae analyses might be affected by different systematics (de Lavallaz & Fairbairn 2011; Wojtak et al. 2015; Calcino & Davis 2017). For example, Calcino & Davis (2017) fit the joint light-curve analysis compilation (JLA; Betoule et al. 2014) considering a systematic error zg as a free parameter and found that zg = (2.6 ± 2.8)×10−4 alleviates the tension surrounding the inferred matter density parameter Ωm. The impact of this zg on the inferred Hubble parameter was investigated in turn by Carneiro et al. (2022), who reported that it leads to an enhanced uncertainty in H0 that might alleviate the current observational tension between the local expansion rate (Riess et al. 2019) and the value of H0 derived from the CMB anisotropy spectrum assuming the standard Λ-cold dark matter (ΛCDM) model.
Our measurement of zg for LINERs, as well as the measurements estimated from the FWHM of Seyfert Is and QSOs (see Fig. 1), fall short by about a factor of 2 of the measurement proposed by Calcino & Davis (2017) as a possible solution to cosmological tensions; additionally, the fraction of AGN in galaxies is known to be low. However, it is still interesting to determine whether this might have any impact on the SNe analysis. We estimated the fraction of AGN in the JLA SNe hosts, searching publicly available catalogs using the SIMBAD database1 by object name when available or by restricting the angular separation to 60 kpc in projection and to a redshift within 10% of that of the SNe (with a maximum redshift difference set to 0.04), when the object name was not available. The search produced a total of 131 multiple matches and 494 unique matches. The multiple matches were visually inspected and resulted in 103 secure matches. The single matches were also inspected visually in some cases. Matches corresponding to unpublished JLA Sloan Digital Sky Survey data had to be discarded. This procedure resulted in a total of 583 total matches with available AGN classification. Of these, only 5 are Seyfert I (broad-line AGN), and 28 are other types of AGN, including LINER and Seyfert II galaxies, which means that ∼5% of SNe hosts are AGN. This percentage is low enough to assume that the SMBH gravitational redshift probably does not affect cosmological inferences from SNe.
On the other hand, the use of quasars as standard candles has recently shown promise (Risaliti & Lusso 2019; Sacchi et al. 2022), and it was argued that QSO Hubble diagrams can be precise enough to constrain, for instance, the matter density parameter (Dainotti et al. 2023). Although quasar redshifts are generally higher than those of SNe Ia samples and the gravitational redshift found here is lower than the systematic proposed by Calcino & Davis (2017) in JLA, its possible effect on the precision of the matter density parameter determination from QSO Hubble diagrams deserves further attention.
5. Concluding remarks
Our aim was to use emission lines in the nuclei and outskirts of AGN and non-AGN galaxies to find signatures of gravitational redshifts produced by the central supermassive black holes in galaxies, and to compare them to gravitational redshift estimates obtained from measured broad-line widths.
We measured redshifts from the inner and third annuli of SAMI galaxies corresponding to the central 1.5 arcsec disk and to the annulus between 4.5 and 7.5 arcsec. We chose well-resolved face-on galaxies with emission lines with single-Gaussian profiles, with and without AGN activity. Our measurements of the central galaxy redshifts are consistent with those reported by the GAMA survey.
The highest average signature of gravitational redshift we found for narrow-line AGN hosts is zGAMA − zout = 1.1 × 10⁻⁴, similar to what we find when using only Hα and Hβ lines. Using all AGN SAMI lines in the red arm, we obtained zg = 0.7 × 10⁻⁴ from zcentral − zout (see Fig. 5). These values are comparable to those inferred from the analysis of the FWHMs of broad-line AGNs and quasars performed in Sect. 2, and are compatible with the gravitational redshift of a central SMBH with 108 − 109 solar masses with a broad-line region with a radius of 0.1 − 1 pc.
Our measured gravitational redshifts are subject to possible contamination by a starburst contribution (SB) because star formation can mask broad-line region (BLR) lines. Pastoriza et al. (1999) showed that a 30% contamination of starburst lines is enough to cause an AGN to appear as a non-AGN in the diagnostic diagrams, that is, to mask out a BLR even when one is present. In particular, for non-AGN galaxies, combinations of starbursts plus a faint AGN are possible. The contamination would be present in both cases, but it would be more significant in the non-AGN. Another possible source of contamination of the central annuli could come from blueshifted outflows (e.g., Muñoz et al. 2022), which might also contribute to the observation of lines with negative values of zcentral − zout in addition to measurement uncertainties of the line redshifts.
The galaxies in our SAMI sample are not extreme AGNs; we have only eight LINER galaxies and one Seyfert II galaxy, that is, AGNs with narrow lines. The analysis of the Seyfert II galaxy in our sample shows that the gravitational redshift of its lines is compatible with zero, which is consistent with emission from a more extended narrow-line region.
In the case of the LINER galaxies, the observation of relatively narrow lines with such a high gravitational redshift is a puzzle that will remain unsolved in this work. Although the gravitational redshift is of the expected order, the FWHM values are too small compared to those given by Eq. (1). Although in Fig. 4 we fix the correct slope, the intercept is two orders of magnitude higher, ffit ∼ 400, than that expected in Eq. (1), f ∼ 1. An interesting possibility to consider here is when the galaxy nucleus is affected by outflows caused by starbursts or by radiation pressure from the BLR. The starburst contamination would cause a decrease in the resulting FWHM. The expected decrease caused by starburst-driven outflows, however, is not enough to explain the low widths of our lines. In addition to a possible role played by the spatial configuration of the emission clouds, another mechanism might be related to radiation pressure. If the clouds were close to radiation pressure equilibrium, this would allow the dynamics of the BLR to show lower velocities, leading to narrower lines emitted from an otherwise broad-line region. As the acceleration due to radiation pressure scales as R−2, its addition to Kepler’s law (Eq. (1)) can considerably increase the factor f when the accretion disk luminosity is close enough to the Eddington limit.
The agreement between GAMA redshifts and our estimates of the SAMI central redshifts demonstrates that the zg of a SMBH is a systematic effect in AGN single-fibre redshifts. This systematic error in the galaxy redshift might affect cosmological parameter estimates that use the redshifts of SNe galaxy hosts. However, we find that only a very small fraction of SNe hosts are Seyfert I AGNs and LINERs. This means that this particular systematic probably does not affect the SNe-based estimates of the matter density and Hubble parameters.
Acknowledgments
We are thankful to Simone Daflon, Rosa Delgado, Luis A. Díaz-García, Renato Dupke and Antonio Hernán-Caballero for useful comments. N.D.P. received support from a RAICES, a RAICES Federal, and PICT-2021-I-A-00700 grants of the Ministerio de Ciencia, Tecnología e Innovación, Argentina. S.C. is partially supported by CNPq (Brazil) with grant 311584/2020-9. J.C.M. acknowledges support from the European Union’s Horizon Europe research and innovation programme (COSMO-LYA, grant agreement 101044612). P.C. is supported by a CONICET PhD fellowship (Argentina). J.S.A. is supported by CNPq (grant no. 307683/2022-2) and Fundação de Amparo à Pesquisa do Estado do Rio de Janeiro – FAPERJ (grant no. 233906).
References
- Baldwin, J. A., Phillips, M. M., & Terlevich, R. 1981, PASP, 93, 5 [Google Scholar]
- Bentz, M. C., & Katz, S. 2015, PASP, 127, 67 [Google Scholar]
- Betoule, M., Kessler, R., Guy, J., et al. 2014, A&A, 568, A22 [NASA ADS] [CrossRef] [EDP Sciences] [Google Scholar]
- Bon, N., Bon, E., Marziani, P., & Jovanović, P. 2015, Astrophys. Space Sci., 360, 41 [CrossRef] [Google Scholar]
- Bongiorno, A., Schulze, A., Merloni, A., et al. 2016, A&A, 588, A78 [NASA ADS] [CrossRef] [EDP Sciences] [Google Scholar]
- Calcino, J., & Davis, T. 2017, JCAP, 01, 038 [CrossRef] [Google Scholar]
- Carneiro, S., Pigozzo, C., & Alcaniz, J. S. 2022, Eur. Phys J. Plus, 137, 537 [NASA ADS] [CrossRef] [Google Scholar]
- Croom, S. M., Owers, M. S., Scott, N., et al. 2021, MNRAS, 505, 991 [NASA ADS] [CrossRef] [Google Scholar]
- Dainotti, M. G., Bargiacchi, G., Lenart, A. L., Nagataki, S., & Capozziello, S. 2023, ApJ, 950, 45 [NASA ADS] [CrossRef] [Google Scholar]
- de Lavallaz, A., & Fairbairn, M. 2011, Phys. Rev. D, 84, 083005 [NASA ADS] [CrossRef] [Google Scholar]
- Eun, D.-I., Woo, J.-H., & Bae, H.-J. 2017, ApJ, 842, 5 [NASA ADS] [CrossRef] [Google Scholar]
- Kauffmann, G., Heckman, T. M., Tremonti, C., et al. 2003, MNRAS, 346, 1055 [Google Scholar]
- Liske, J., Baldry, I. K., Driver, S. P., et al. 2015, MNRAS, 452, 2087 [Google Scholar]
- Magorrian, J., Tremaine, S., Richstone, D., et al. 1998, ApJ, 115, 2285 [CrossRef] [Google Scholar]
- Marziani, P., Sulentic, J. W., Plauchu-Frayn, I., & del Olmo, A. 2013, A&A, 555, A89 [NASA ADS] [CrossRef] [EDP Sciences] [Google Scholar]
- Mediavilla, E., & Jiménez-Vicente, J. 2021, ApJ, 914, 112 [NASA ADS] [CrossRef] [Google Scholar]
- Mediavilla, E., Jiménez-Vicente, J., Fian, C., et al. 2018, ApJ, 862, 104 [Google Scholar]
- Mpetha, C. T., Collins, C. A., Clerc, N., et al. 2021, MNRAS, 503, 669 [NASA ADS] [CrossRef] [Google Scholar]
- Muñoz, L. H., Márquez, I., Cazzoli, S., Masegosa, J., & Agís-González, B. 2022, A&A, 660, A133 [NASA ADS] [CrossRef] [EDP Sciences] [Google Scholar]
- Nandra, K., George, I. M., Mushotzky, R. F., Turner, T. J., & Yaqoob, T. 1997, ApJ, 477, 602 [NASA ADS] [CrossRef] [Google Scholar]
- Pastoriza, M. G., Donzelli, C. J., & Bonatto, C. 1999, A&A, 347, 55 [NASA ADS] [Google Scholar]
- Rakshit, S., Stalin, C. S., & Kotilainen, J. 2020, ApJS, 249, 17 [Google Scholar]
- Riess, A. G., Casertano, S., Yuan, W., Macri, L. M., & Scolnic, D. 2019, ApJ, 876, 85 [Google Scholar]
- Risaliti, G., & Lusso, E. 2019, Nat. Astron., 3, 272 [Google Scholar]
- Rosselli, D., Marulli, F., Veropalumbo, A., Cimatti, A., & Moscardini, L. 2023, A&A, 669, A29 [NASA ADS] [CrossRef] [EDP Sciences] [Google Scholar]
- Sacchi, A., Risaliti, G., Signorini, M., et al. 2022, A&A, 663, L7 [NASA ADS] [CrossRef] [EDP Sciences] [Google Scholar]
- Wojtak, R., Hansen, S. H., & Hjorth, J. 2011, Nature, 477, 567 [NASA ADS] [CrossRef] [Google Scholar]
- Wojtak, R., Davis, T. M., & Wiis, J. 2015, JCAP, 07, 025 [CrossRef] [Google Scholar]
Appendix A: List of SAMI IDs and AGN classification diagrams
We present the list of SAMI IDs for the galaxies used in this work. Non-AGN galaxies (including composite and starbursts): 30916, 31452, 40283, 47460, 77452, 85474, 99349, 106616, 136263, 138047, 144239, 204799, 216670, 229167, 238125, 239376, 239560, 319020, 319400, 372374, 396607, 517247, 519089, 559061, 561020, 567624, 570090, 593680, 619737, 620034, 623432. LINER galaxies: 54198, 65406, 106549, 145729, 373202, 396621, 550328, 583427. The Seyfert II galaxy in the sample corresponds to ID 209698. In Fig. A.1 we show the classification diagrams.
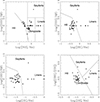 |
Fig. A.1. Classification diagrams for the SAMI galaxies according to Kauffmann et al. (2003). Cases with zero line luminosity in Hβ or [OI] 6300 Angströms are still shown, with the y-axis or x-axis position set to 0. |
All Tables
Redshift differences between the central and outer annuli as obtained from SAMI data and from adopting the GAMA redshift as the central redshift.
All Figures
|
Fig. 1. Normalized distributions of gravitational redshifts indirectly derived from the FWHM of Hβ broad lines of SDSS DR14 quasars (Rakshit et al. 2020, solid), and of Hβ broad lines of 57 Seyfert type I galaxies cataloged in the AGN Black Hole Mass Database (Bentz & Katz 2015, dashed lines). The median and dispersion of the distribution for the SDSS DR14 quasars are median(zg) = 1.52 × 10⁻⁴, and Std(log10(zg)) = 0.49, and for the AGN Black Hole Mass Database, they are median(zg) = 1.18 × 10⁻⁴, and Std(log10(zg)) = 0.58. |
| In the text | |
|
Fig. 2. Example spectrum for galaxy S372374 in the blue (top) and red arms of the SAMI spectrograph (middle). The different lines used in our analysis are indicated in the spectrum. The bottom panels show two example fits (red dashed lines) for which we used Gaussian functions via the SPLOT routine in IRAF. |
| In the text | |
|
Fig. 3. Distribution functions of the variation in zg for (LINER) and non-AGN (SB/composite) lines within individual galaxies. The legend shows the error on the mean of the distribution, which we assigned as the error in the measured redshift differences for the different samples. Top: results from using all available lines. Bottom: same for red lines alone. Their spectral resolution is better. |
| In the text | |
|
Fig. 4. Correlation zg × FWHM for LINER (solid dots) and SB/composite (empty dots) galaxies. The gravitational redshift zg is given by the difference zcentral − zout between the redshifts of each line measured in the central and outer regions. The FWHMs are measured at the inner annulus. The line shows a fit following Eq. (1), where only the amplitude is fitted to the points, corresponding to ffit ∼ 400. |
| In the text | |
|
Fig. 5. Histograms of zcentral − zout for LINER and non-AGN galaxies (upper panel). In the lower panel, we also show the histograms for zGAMA − zout and zGAMA − zcentral. In this panel, the size of the bin for the GAMA LINER comparison is twice as large than in the other histograms in this figure to reduce noise. |
| In the text | |
|
Fig. A.1. Classification diagrams for the SAMI galaxies according to Kauffmann et al. (2003). Cases with zero line luminosity in Hβ or [OI] 6300 Angströms are still shown, with the y-axis or x-axis position set to 0. |
| In the text | |
Current usage metrics show cumulative count of Article Views (full-text article views including HTML views, PDF and ePub downloads, according to the available data) and Abstracts Views on Vision4Press platform.
Data correspond to usage on the plateform after 2015. The current usage metrics is available 48-96 hours after online publication and is updated daily on week days.
Initial download of the metrics may take a while.