Open Access
Fig. 5.
Download original image
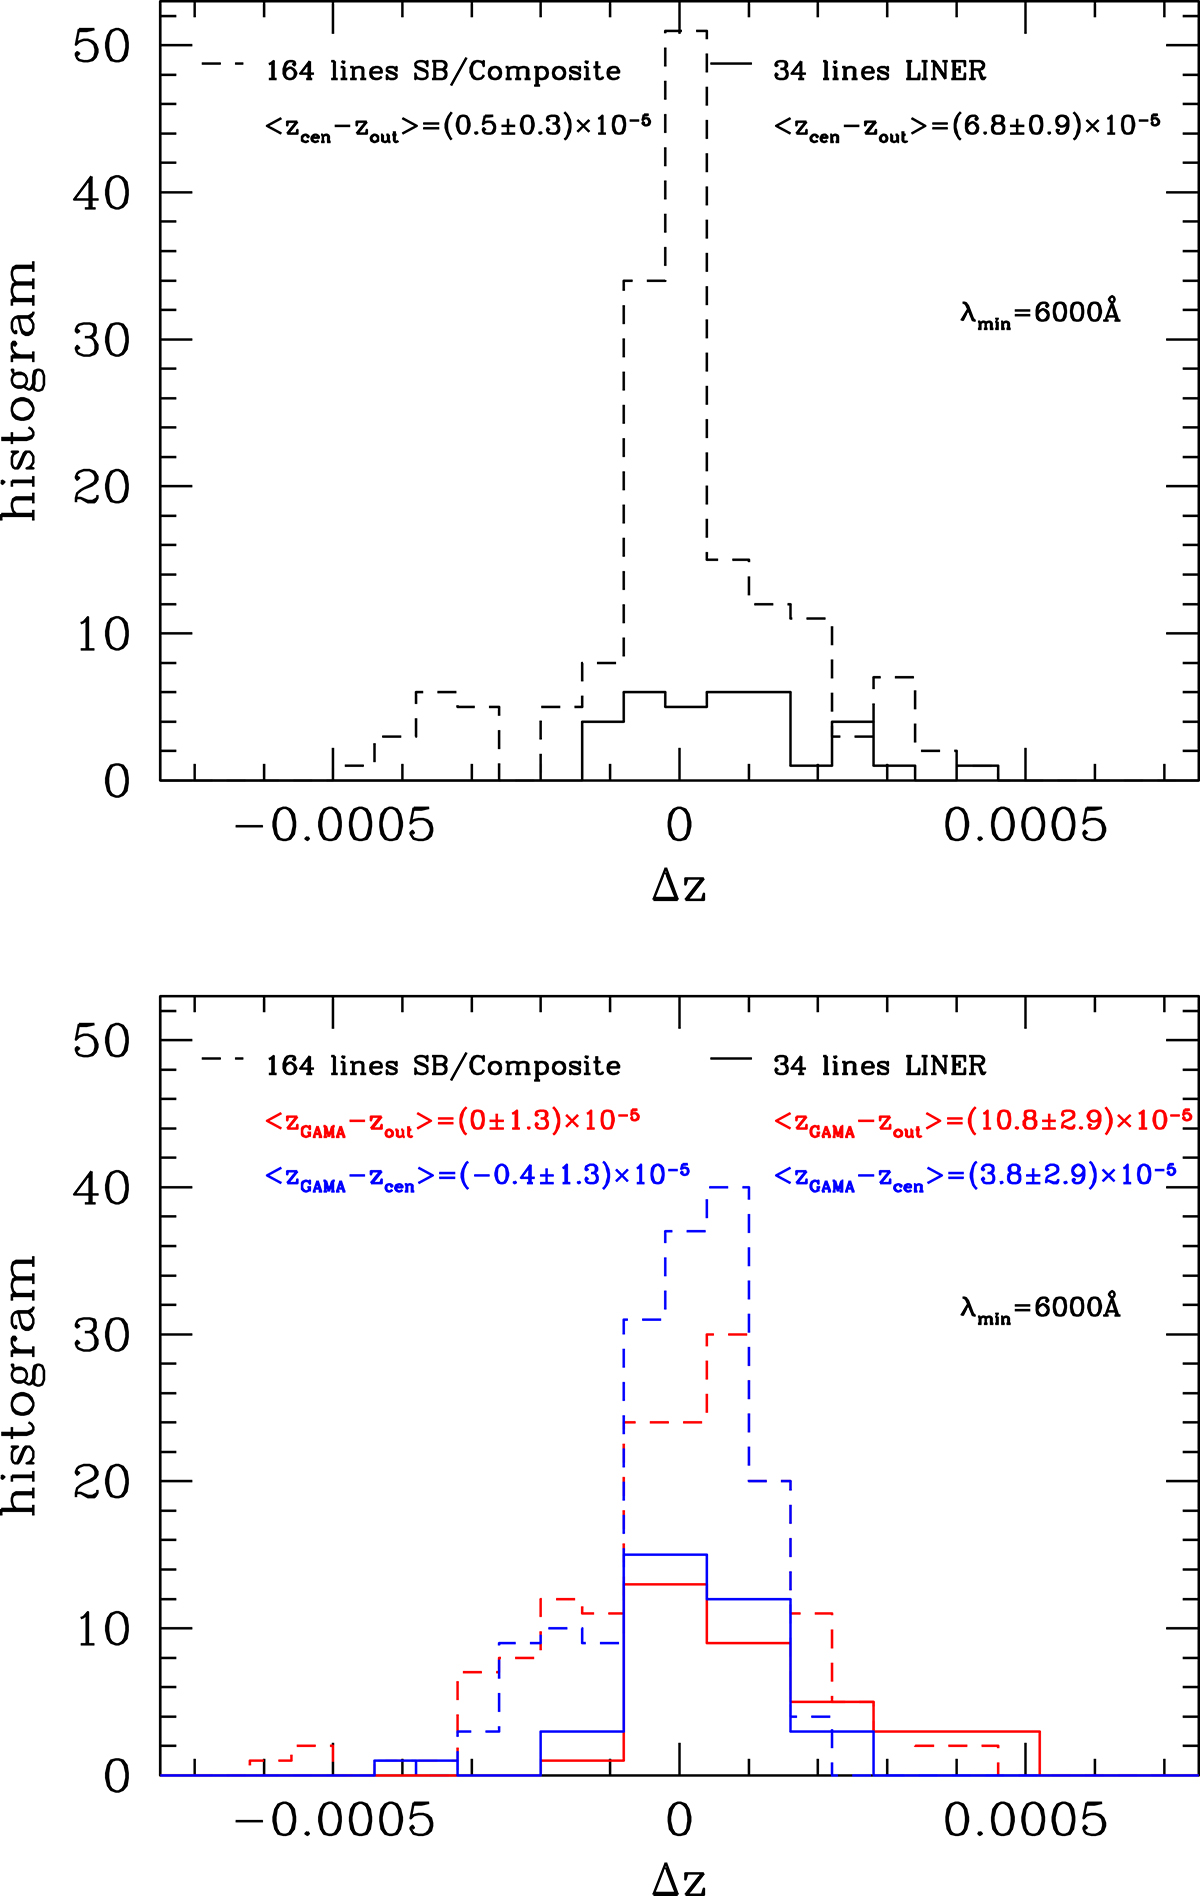
Histograms of zcentral − zout for LINER and non-AGN galaxies (upper panel). In the lower panel, we also show the histograms for zGAMA − zout and zGAMA − zcentral. In this panel, the size of the bin for the GAMA LINER comparison is twice as large than in the other histograms in this figure to reduce noise.
Current usage metrics show cumulative count of Article Views (full-text article views including HTML views, PDF and ePub downloads, according to the available data) and Abstracts Views on Vision4Press platform.
Data correspond to usage on the plateform after 2015. The current usage metrics is available 48-96 hours after online publication and is updated daily on week days.
Initial download of the metrics may take a while.