Open Access
Fig. 2.
Download original image
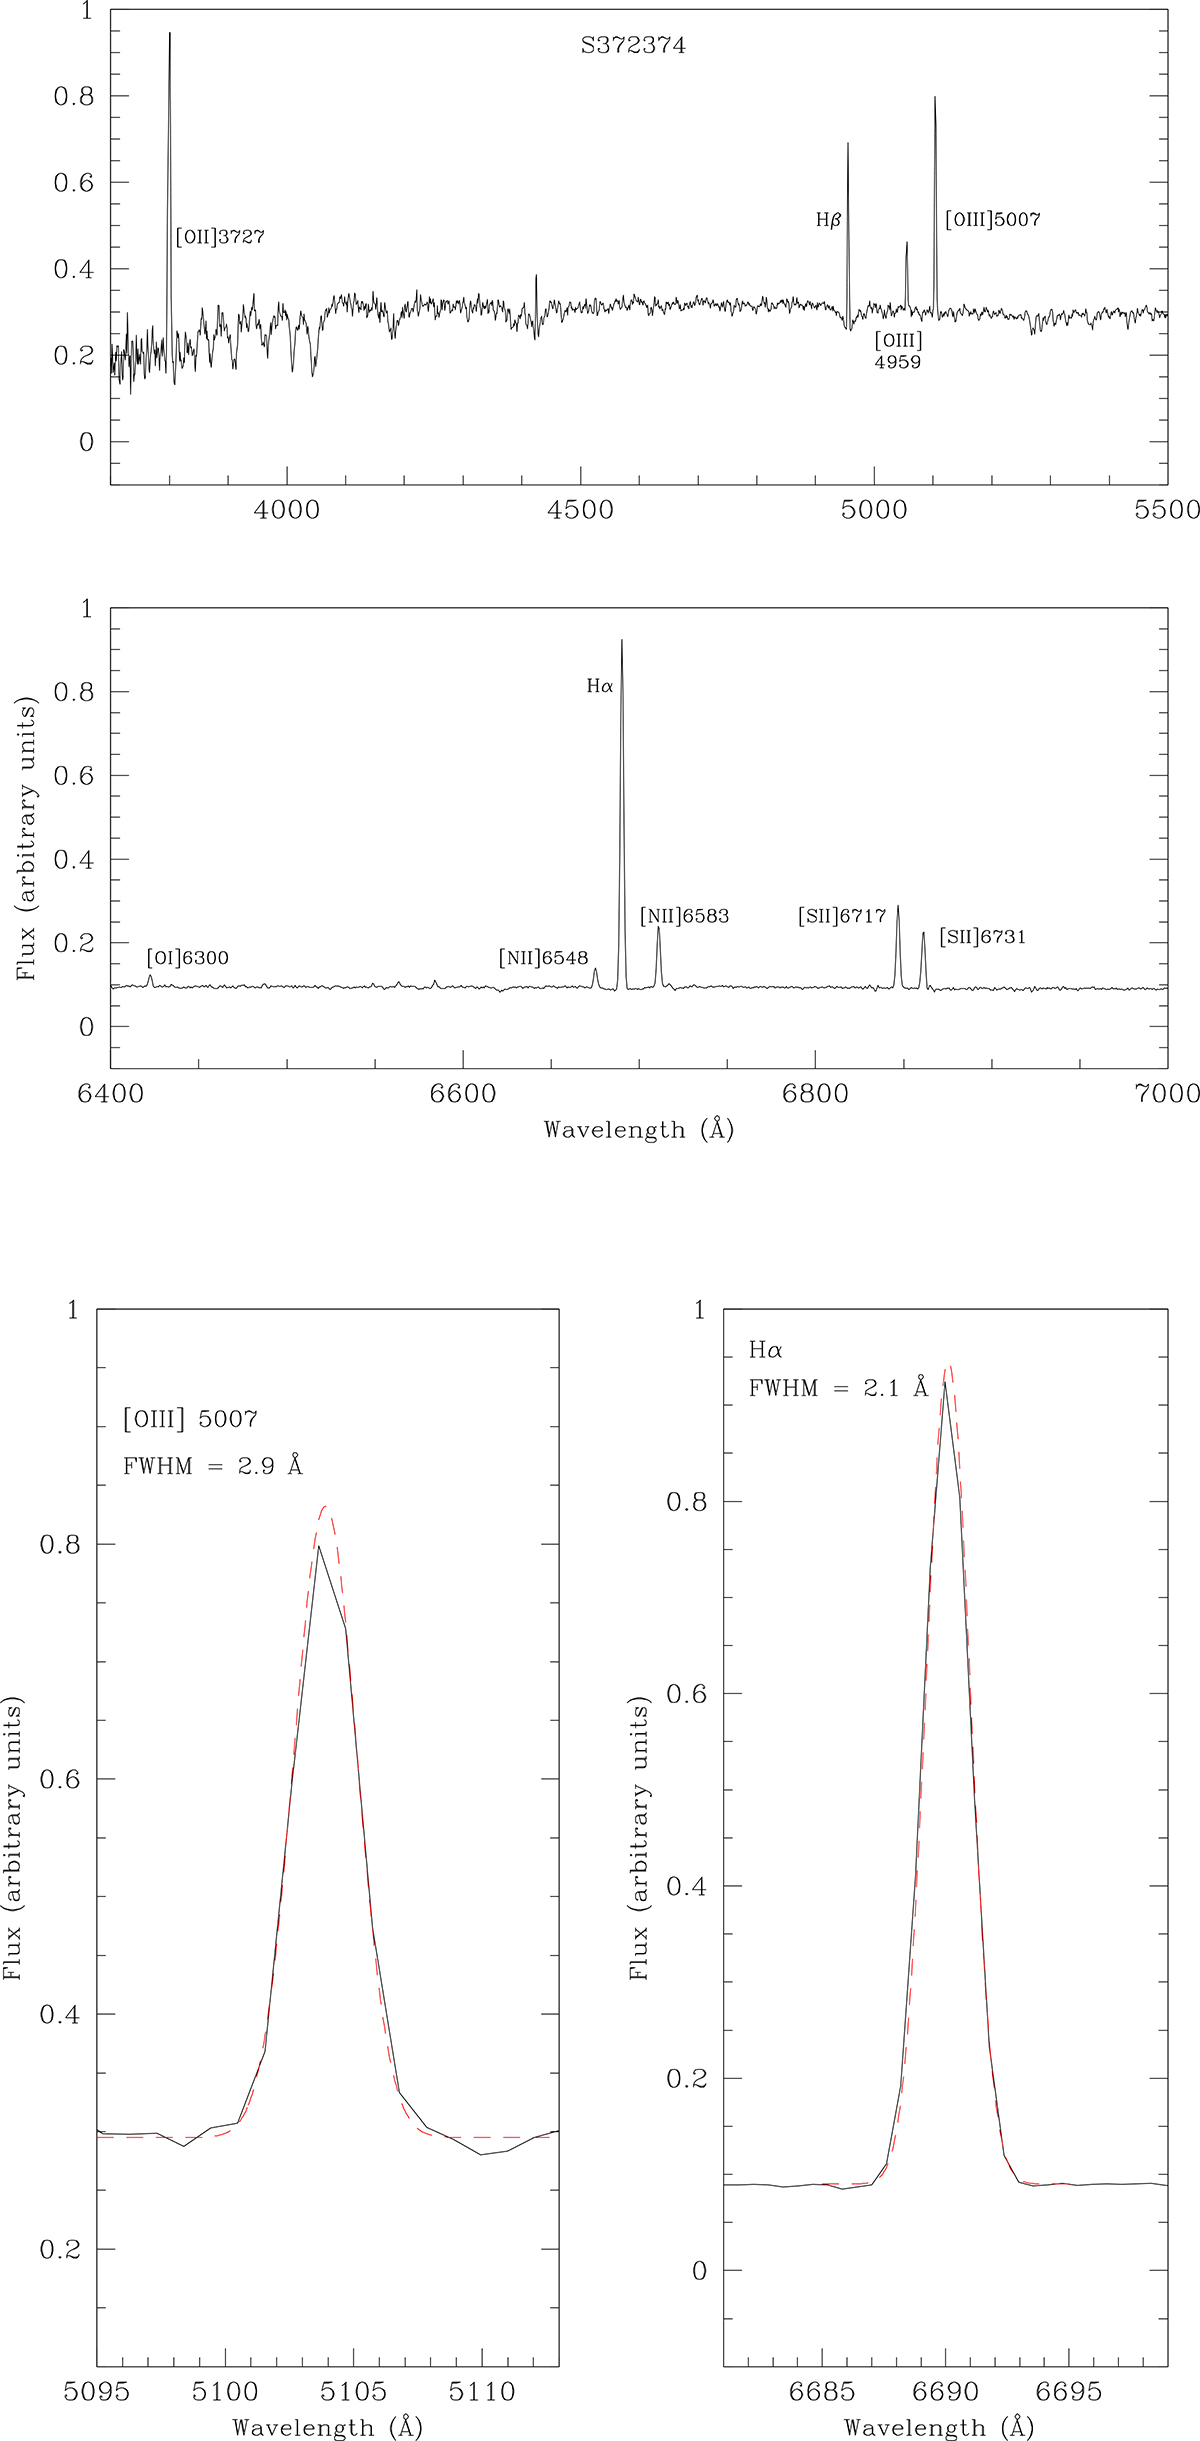
Example spectrum for galaxy S372374 in the blue (top) and red arms of the SAMI spectrograph (middle). The different lines used in our analysis are indicated in the spectrum. The bottom panels show two example fits (red dashed lines) for which we used Gaussian functions via the SPLOT routine in IRAF.
Current usage metrics show cumulative count of Article Views (full-text article views including HTML views, PDF and ePub downloads, according to the available data) and Abstracts Views on Vision4Press platform.
Data correspond to usage on the plateform after 2015. The current usage metrics is available 48-96 hours after online publication and is updated daily on week days.
Initial download of the metrics may take a while.