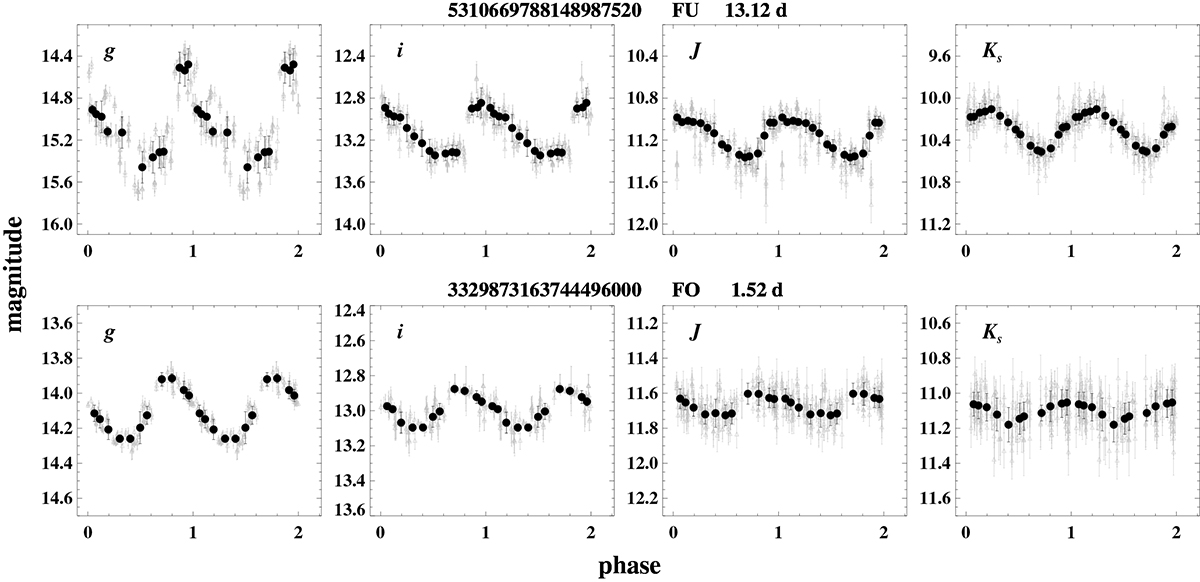
Fig. 4.
Download original image
Example light curves of FU (top) and FO mode (bottom) Cepheids based on all the photometric data (in grey) from the dithered frame images. The light curves are shown in two optical (gi) and two NIR (JKs) filters. The black circles represent the weighted mean values in a given phase bin and the errors represent their standard deviations. The range of y-axis is the same in each band for a given Cepheid. The Gaia source ID, pulsation mode, and the periods are listed at the top of each panel.
Current usage metrics show cumulative count of Article Views (full-text article views including HTML views, PDF and ePub downloads, according to the available data) and Abstracts Views on Vision4Press platform.
Data correspond to usage on the plateform after 2015. The current usage metrics is available 48-96 hours after online publication and is updated daily on week days.
Initial download of the metrics may take a while.