Open Access
Fig. 8.
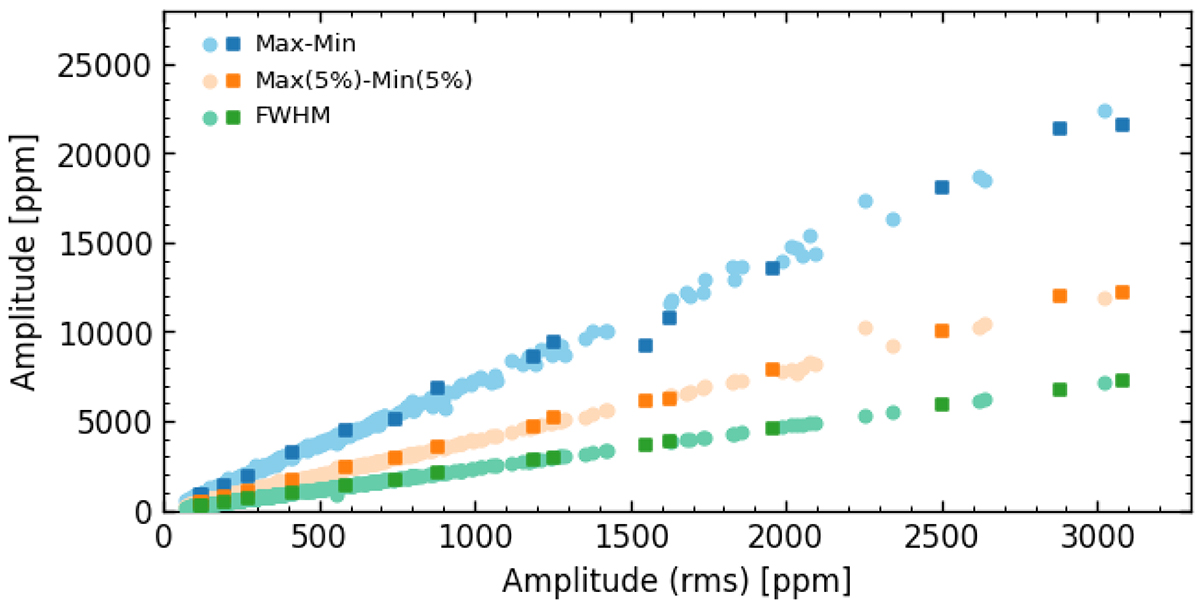
Download original image
Variability amplitude obtained using different methods used in this study compared to the amplitude determined from the rms method (see text for the details). The darker square and lighter circle symbols distinguish between symbiotic stars and red giants (see Sect. 4), respectively.
Current usage metrics show cumulative count of Article Views (full-text article views including HTML views, PDF and ePub downloads, according to the available data) and Abstracts Views on Vision4Press platform.
Data correspond to usage on the plateform after 2015. The current usage metrics is available 48-96 hours after online publication and is updated daily on week days.
Initial download of the metrics may take a while.