Open Access
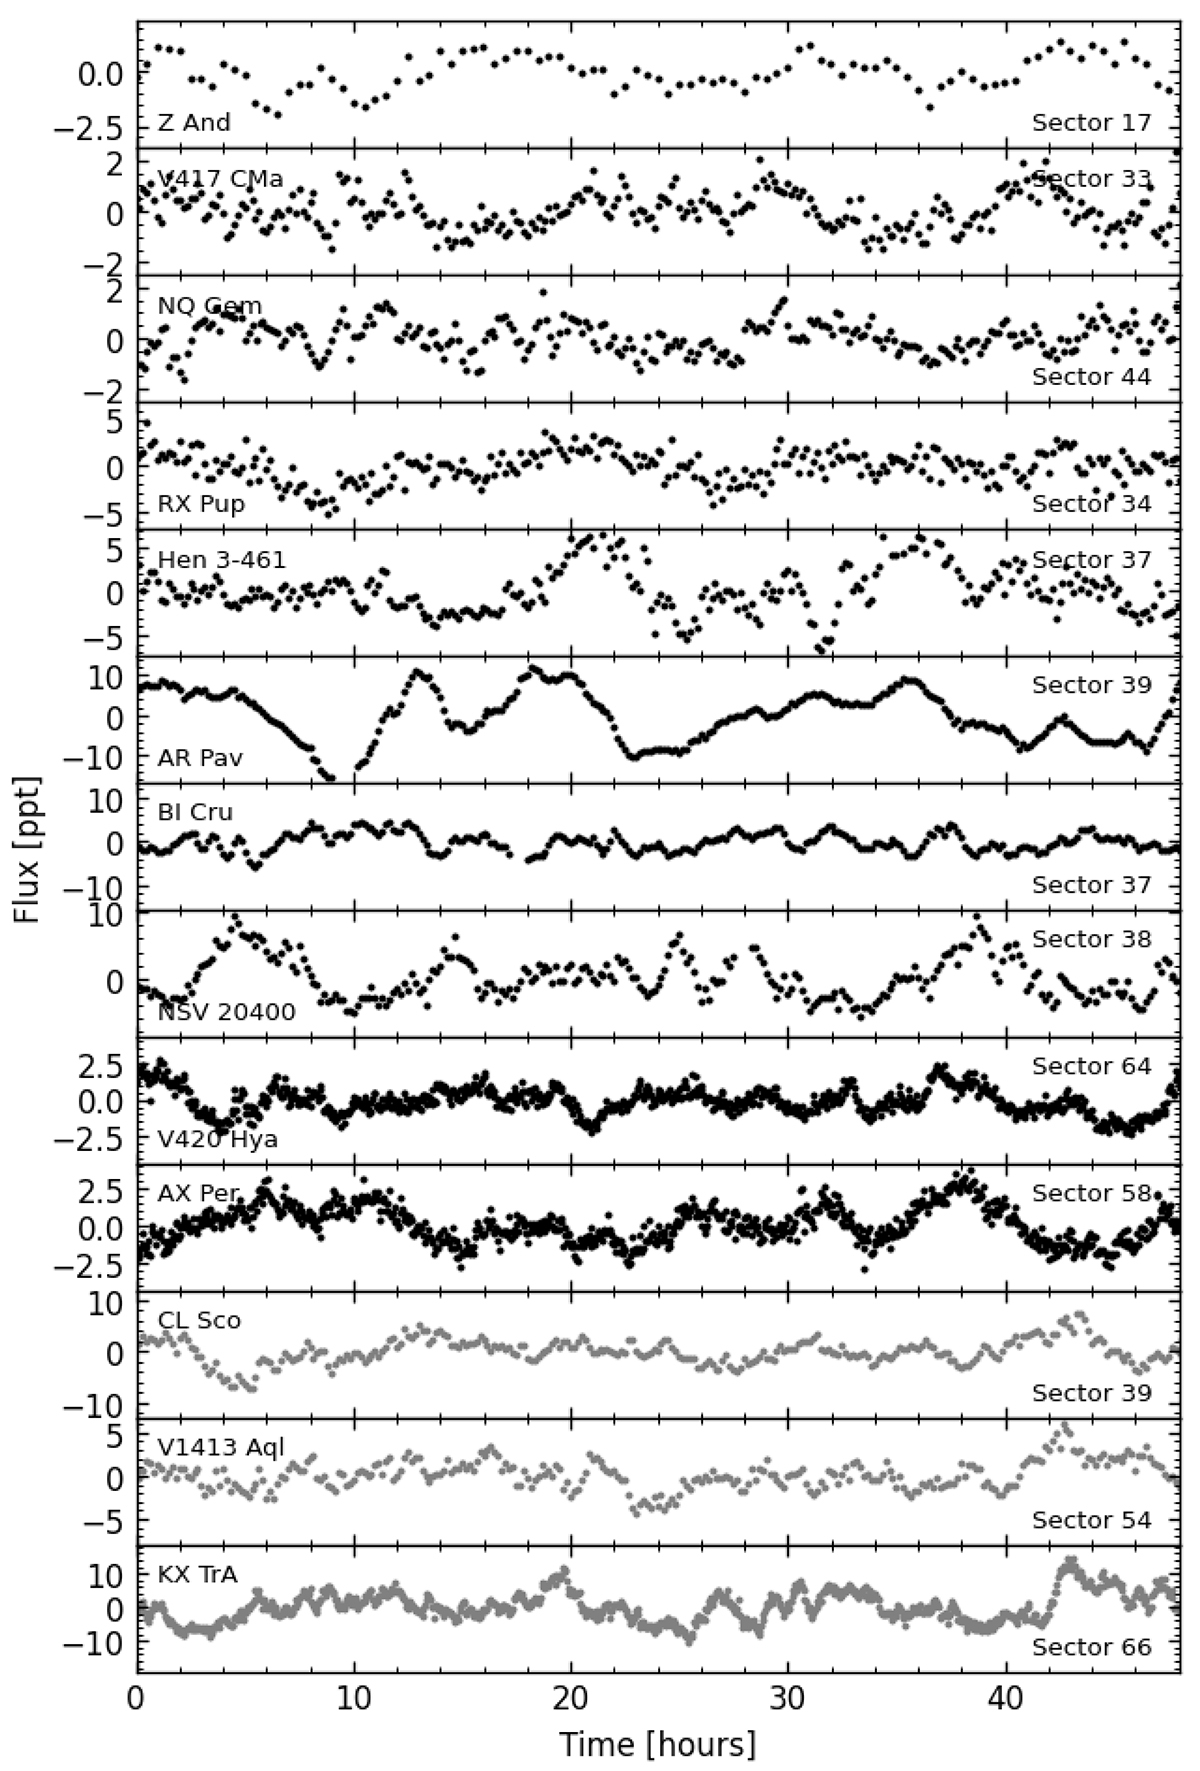
Fig. 19.
Download original image
Two-day long parts of the SG filtered light curves of newly classified flickering sources among symbiotic stars. The black and gray light curves distinguish between isolated sources and potentially contaminated sources, respectively.
Current usage metrics show cumulative count of Article Views (full-text article views including HTML views, PDF and ePub downloads, according to the available data) and Abstracts Views on Vision4Press platform.
Data correspond to usage on the plateform after 2015. The current usage metrics is available 48-96 hours after online publication and is updated daily on week days.
Initial download of the metrics may take a while.