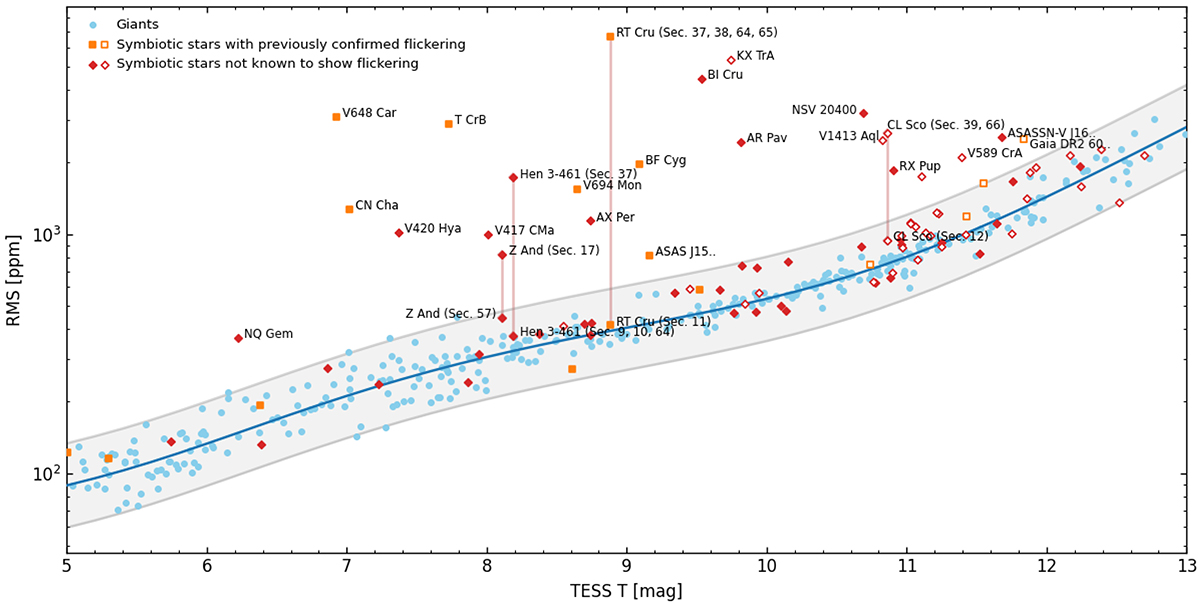
Fig. 18.
Download original image
rms variability amplitude of symbiotic stars that were not previously known as flickering sources (depicted by red diamonds) alongside the known flickering sources (orange squares; Table 1 and Fig. 14) and red giants from our control sample (represented by blue circles). Filled and empty squares-diamonds indicate isolated and potentially contaminated sources, respectively. The average rms values are shown for sources that do not exhibit significant variation between sectors.
Current usage metrics show cumulative count of Article Views (full-text article views including HTML views, PDF and ePub downloads, according to the available data) and Abstracts Views on Vision4Press platform.
Data correspond to usage on the plateform after 2015. The current usage metrics is available 48-96 hours after online publication and is updated daily on week days.
Initial download of the metrics may take a while.