Open Access
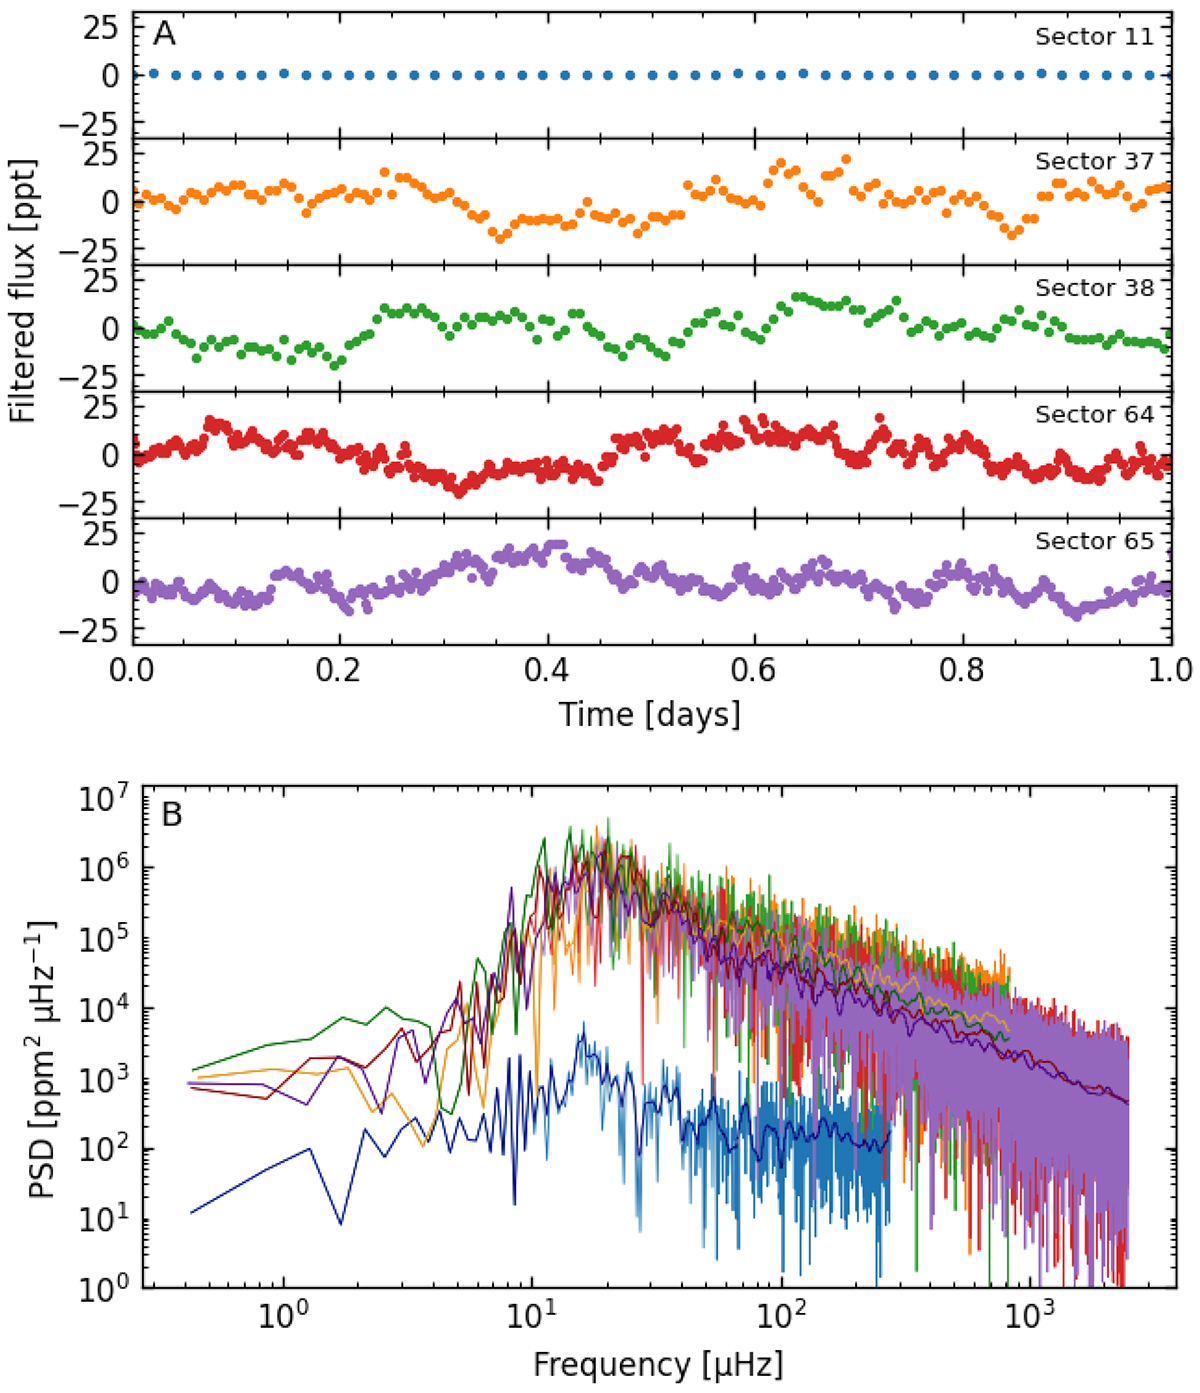
Fig. 17.
Download original image
TESS data of the symbiotic star RT Cru. A: processed and filtered light curves extracted from four observed sectors. Portions spanning one day are shown for clarity. B: PSD for the observed sectors, with each color representing a different light curve from panel A.
Current usage metrics show cumulative count of Article Views (full-text article views including HTML views, PDF and ePub downloads, according to the available data) and Abstracts Views on Vision4Press platform.
Data correspond to usage on the plateform after 2015. The current usage metrics is available 48-96 hours after online publication and is updated daily on week days.
Initial download of the metrics may take a while.