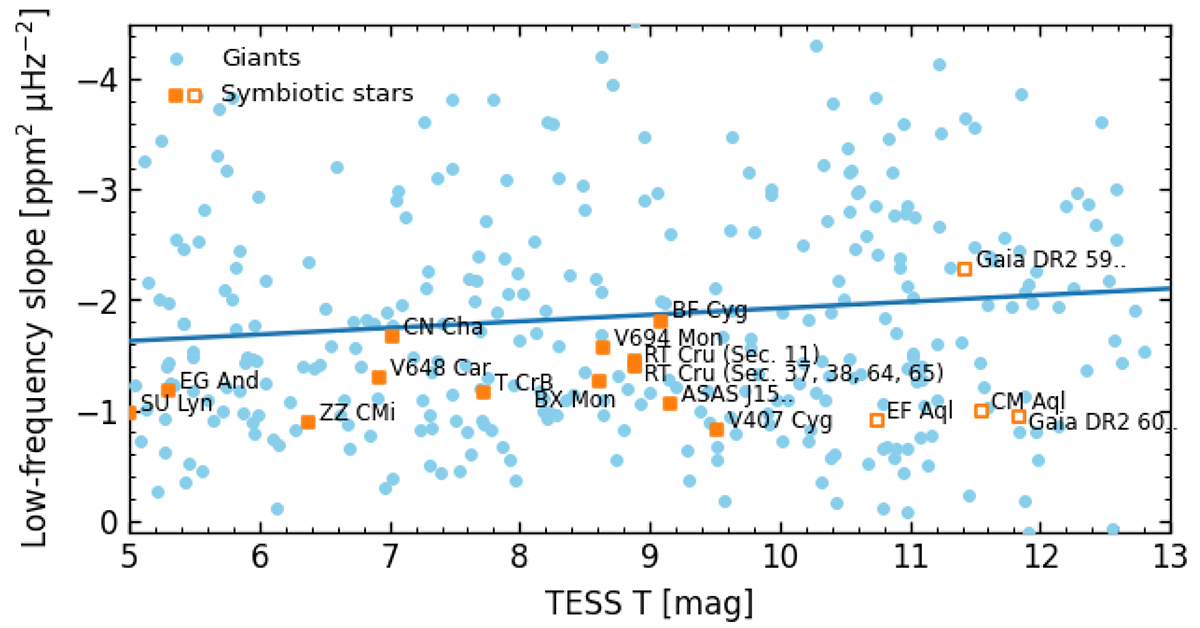
Fig. 11.
Download original image
Low-frequency slope of the PSD of studied symbiotic sources (orange squares) and red giants from our control sample (blue circles) shown against the magnitudes of the targets from the TESS Input Catalog. Filled squares indicate isolated sources, while empty squares represent potentially contaminated sources. With the exception of RT Cru (Sect. 4.3; two epochs are connected with a vertical line), the average values for all available sectors are shown in the figure. The blue line shows the formal linear fit to the dependence for giants.
Current usage metrics show cumulative count of Article Views (full-text article views including HTML views, PDF and ePub downloads, according to the available data) and Abstracts Views on Vision4Press platform.
Data correspond to usage on the plateform after 2015. The current usage metrics is available 48-96 hours after online publication and is updated daily on week days.
Initial download of the metrics may take a while.